US Ignite Summit: Building the next digital world (and what it means for Chicago)

Ballroom Crowd at the US Ignite Application Summit at the Allegro Hotel, Chicago

The US Ignite Summit highlighted the potential and the opportunities that the next generation internet will bring to the United States. The next generation internet will have upload and download speeds above 1000MBps. (For comparison, the average download speed in Chicago is 50Mbps and the average upload speed is only 10MBps.)

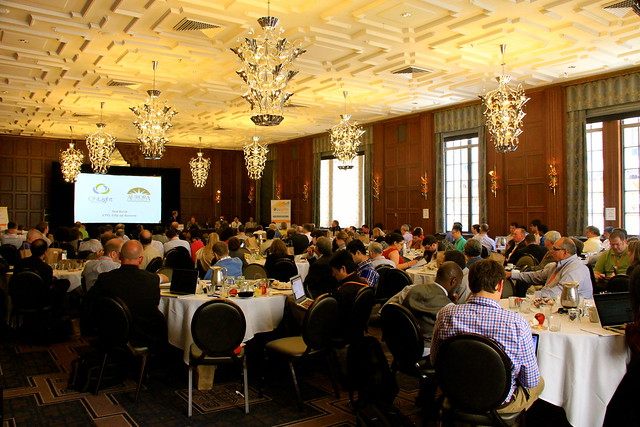
The summit highlighted the potential of next generation apps and the economic development that’s possible with gigabit internet. The summit was attended by 300 people, 53 of whom hailed from the City of Chicago. Through Smart Chicago’s sponsorship of the event we were able to give out several free passes to Chicago residents to ensure that there was a wide variety of fields represented at the conference.

Pallavi Anderson leads a group at the Ideation session of US Ignite

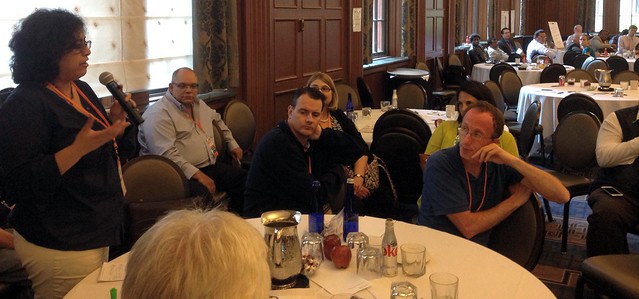
Smart Chicago Collaborative also ran an ideation session as part of the summit. With so much money, time and effort being invested into the gigabit internet it’s important to gain a wide variety of perspectives on what we could do with the next generation internet. Several fantastic ideas where generated out of this session including apps centered around emergency response, healthcare, and library systems.

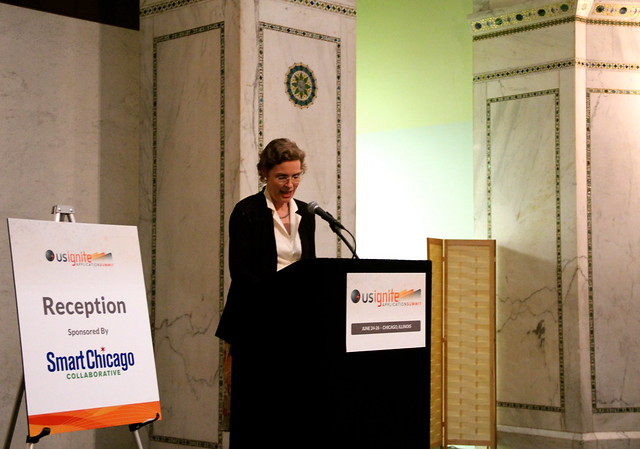
Smart Chicago Collaborative was also proud to host a reception where internet advocate Susan Crawford spoke about the progress of communication technology – and how we can support real world ties with technology.

Susan Crawford Addresses the US Ignite Application Summit at the Cultural Center in Chicago

Gigabit internet is coming to Chicago. Smart Chicago Collaborative looks forward to assisting in efforts to bring the next generation internet here and looks forward to the economic and social opportunities that it will bring.


U.S. Ignite Application Summit and the Future of Gigabit Chicago

Last year I attended the US Ignite launch event at the White House (see full video here), where a number of Obama administration officials made a series of announcements about programs around broadband policy. It was a wide-ranging and mind-boggling series of speakers, and I wrote up some thoughts about what it all meant for Chicago.

Executive Office Building, Washington DC

This is an age of conception— we are limited only by our imaginations

Since then, I’ve continued to take interest in US Ignite and their efforts to foster the creation of next-generation Internet applications that provide transformative public benefit. The investments made here in Chicago, including the Gigabit Squared project that includes $2 million of investment from the State of Illinois as well as the Broadband Challenge from the City of Chicago— show that Chicago is very much a part of the Gigabit future.

What has struck me most, as I follow this work, is how far we have to go in terms of conceiving what this next-generation network looks like for regular people.

That’s why we’re a sponsor of the US Ignite Application Summit being held in Chicago June 24th – 26th.

What could you build if you weren’t restricted by the limits of network speed and latency? What if your network could support gigabit download and upload speeds? What if the power of cloud data centers wasn’t located on the east coast, but placed in your own backyard? What would you build?  What businesses could you launch if there were no limits?

That’s what we want to find out at this three-day event, running from June 24th to June 26th at the Allegro Hotel and UIC. We’ll be posting regularly from the Summit, so follow along on our Twitter and Facebook accounts.


Chicago Health Atlas Data Feeds

Today we’ve added support for querying the data that appears on Chicago Health Atlas by adding JSON endpoints for the major pages. If you want to get access to the underlying data that drives our maps and charts, just add “.json” to the URL of pretty much any page and we’ve got you covered.

Examples:

You can see all community area and zip code boundaries in Chicago by eyeballing our map:

Chicago Health Atlas Map

Or you can see the raw data http://www.chicagohealthatlas.org/places.json:

Chicago Health Atlas Places JSON

You can see all birth rate data by year or see the data all at once.
Birth rate data for the Loop area with confidence intervals as json.

Thanks to Dan Sinker and Cory Nissen for asking for this feature and Derek Eder for getting it done lickety-split.


See also Cory’s method for querying this site– thanks for doing this, Cory.

Have at it!

The Launch of Chicago Health Atlas

Today we’re happy to announce the launch of our latest project, the Chicago Health Atlas, where you can view citywide information about health trends and take action near you to improve your own health.

The Chicago Health Atlas is a place where you can view citywide information about health trends and take action near you to improve your own health.

You can read all about the making of the Chicago Health Atlas on our project page. It’s quite a story of collaboration. We pulled sprawling amounts of city-wide health data into a cohesive view of health near you.

  • It all starts with Otho S.A. Sprague Memorial Institute, the project funder, and Jim Alexander, the Institute’s Executive Director and the conceptual leader behind the project
  • We worked with Abel Kho and some of the largest providers of health care in Chicago to develop tools which balanced the need for anonymity of patients and providers, while preserving uniqueness of patients. Read more about their work here
  • Eric Jones and Jamyia Clark of the Chicago Department of Public Health have been instrumental in shepherding the CDPH data into the Atlas— explaining the data, advising on presentation, and generally acting as an intermediary between the Web development and health informatics sides of the project. He also presents the project to the health science community at places like the 2013 Council of State and Territorial Epidemiologists Annual Meeting

Read more about data sources on the Chicago Health Atlas About page.

On the Smart Chicago side, Program Officer Kyla Williams oversees all of our health initiatives and has been a great leader. Long-time consultant Derek Eder of Data Made has been essential to the success of this project. His deep experience with mapping Chicago things has been a huge natural resource. Aaron Salmon of Auraworks is the design lead for this project.

Patrice Coleman is our Project Coordinator in charge of outreach. Want to take part? Let’s do it.

Livestream: Brett Goldstein of Chicago’s Department of Innovation & Technology


The City’s Data Portal has swelled to over 450 datasets. City staff use data to make smarter, better decisions. Programs are in place to cultivate internal talent.

Join us for a discussion with Brett Goldstein, Chief Data Officer and Chief Information Officer, who will talk about his work of the past two years to transform information technology at the City of Chicago. This is Brett’s last visit to OpenGovChicago before leaving city government for academia and the private sector.

The live stream of this event will begin at tonight at 6:15ish on this blog post.