Issue Primer: Health

Health Datapalooza CodeathonFor this year’s National Day of Civic Hacking, we’re writing up primers on different civic issues to help people get a better understanding of the issues as they start working on projects.

Below, we’ve listed out places where you can data on health, some examples of projects centered around health and human services , and some resources online to help you with your project.

Health and Human Services 

Healthcare and the social services that are often connected to it is an extremely complicated and expensive issue. According to the Kaiser Foundation, the United States spent about $2 trillion dollars on health care.

In addition to regular healthcare, state and local governments spend a tremendous amount of funds on social services. The effects of the recession, pension crises in multiple states, and cuts from Congress have caused state and local governments to make drastic cuts to social services. This happened at exactly the time that more people required social services putting significant strain on the social safety net.

Aside from the big picture, the experience of those receiving social service is an innately human one – and an experience that most Americans don’t have. Most Americans at some point have to go to the DMV and the experience is often portrayed as downright in pop culture as downright terrible. The experience of being on social services often is worse – not in just the big picture sense, but in small ways. The social safety net is managed by a multitude of government agencies and nonprofit organizations.

Technology projects, such as mRelief, center around health and human services often try and help residents better navigate and understand the resources available to them.

Data Resources 

Data.gov/health

The federal data portal contains over 800 datasets on health. We’ve highlighted some key ones:

  • Hospital Charge Data: Data are being released that show significant variation across the country and within communities in what providers charge for common services. These data include information comparing the charges for the 100 most common inpatient services and 30 common outpatient services.  Providers determine what they will charge for items and services provided to patients and these charges are the amount the provider’s bills for an item or service.
  • Community Health Status Indicators (CHSI): to combat obesity, heart disease, and cancer are major components of the Community Health Data Initiative.
  • CDC Cancer Statistics: The United States Cancer Statistics (USCS) online databases in WONDER provide cancer incidence and mortality data for the United States for the years since 1999, by year, state and metropolitan areas (MSA), age group, race, ethnicity, gender, childhood cancer classifications and cancer site.

County Government Data 

Many county governments administer their own health and human service systems – some of which release this data to the public.

Cook County, IL (https://datacatalog.cookcountyil.gov) 

  • Burial Locations: The following page lists the final disposition sites of the indigents buried by the Cook County Medical Examiner’s Office.
  • Health & Hospitals System – Outpatient Registrations, by Facility, Zip Code, Month – Fiscal Year 2011: Enclosed data represents outpatient registrations including hospital ancillary services

San Francisco, CA [City and County] (data.sf.gov)

  • Child Care Subsidies, San Francisco, CA: Data illustrate the total number of state and non-state child care subsidies available as well as the number of children (0-12 years old) that are eligible for subsidies and the difference between these two numbers by zip code in San Francisco.
  • HSA 90 Day Emergency Housing Waitlist: Provides the seniority list for entry into HSA 90 day emergency shelter waitlist. The list will be generated on 2/24/14 and updated twice daily.

State Government Data 

States administer Medicare, Medicaid and often provide funding for local health and human service programs. Below is a highlight of some state data sets.

Illinois (data.illinois.gov) 

  • Affordable Care Act (ACA) Enrollment Summary Data: Affordable Care Act (ACA) enrollment data by age, race, gender, and county. (PDF)
  • Reportable Communicable Disease Cases, 2010 – 2012: Data provided by the Communicable Disease Section of the Office of Health Protection’s Division of Infectious Diseases

New York (data.ny.gov) 

  • Assisted Outpatient Treatment) Court Orders: This dataset contains the number recipients with AOT petitions and court orders and their length of time on court order, by county, region and statewide.
  • Genealogical Research Death Index Beginning 1957: The Genealogical Research Death Index assists individuals with locating New York State (NYS) death records that fall within defined genealogy years, exclusive of New York City recorded death records

City Government Data

Cities are also releasing data on health and social services. Here’s some highlights from different cities.

Chicago (data.cityofchicago.org) 

  • Food Inspections: This information is derived from inspections of restaurants and other food establishments in Chicago from January 1, 2010 to the present.
  • Neighborhood Health Clinics (Historical): Former neighborhood health clinic locations, hours of operation and contact information. These clinics were closed or transferred to private management in July 2012
  • Infant Death Mortality in Chicago: This dataset contains the annual number of infant deaths annually, cumulative number of infant deaths, and average annual infant mortality rate with corresponding 95% confidence intervals, by Chicago community area, for the years 2005 – 2009

Boston (https://data.cityofboston.gov)

  • Asbestos Removal Permits: Boston Public Health Commission Asbestos permitting removal of asbestos.

New York City (https://nycopendata.socrata.com) 

  • New York City Leading Causes of Death: The leading causes of death by sex and ethnicity in New York City in since 2007
  • New York City Health and Hospitals Corporation (HHC) Patient Satisfaction Survey: Patient satisfaction at HHC hospitals is measured by a standardized survey known as the Hospital Consumer Assessment of Healthcare Providers & Systems (HCAHPS). The survey has been validated by the federal Centers for Medicare and Medicaid Services (CMS) as a standard assessment tool for all hospitals throughout the nation.
  • Most Popular Baby Names by Sex and Mother’s Ethnic Group, New York City: The most popular baby names by sex and mother’s ethnicity in New York City.

Potential Partners

The best civic apps are built through partnerships between technologists, residents, and the people who work on the front lines. Here’s a list of potential partners you can work with in your own cities to help build projects that can make an impact.

Health Data Consortium: The Health Data Consortium is a public-private partnership working to foster the availability and innovative use of open health data to improve health and healthcare. This organization is particularly useful for government agencies looking for help opening up health data.

Code for America Health Focus Team: The health focus area works to improve the health of people and their communities. Code for America works with the wide variety of teams that contribute to these outcomes—including city health departments, public health agencies, state offices, and non-profit organizations.

Smart Chicago CollaborativeSmart Chicago’s multiple health initiatives provide equipment, training, and information that allow residents to take action to improve their own health. We are strong advocates for promoting open data practices in the healthcare field. Smart Chicago is always happy to talk and share our work.

Local Health Departments: Local health departments are in the trenches on a daily basis working to make their communities healthier and can make great partners.  The Chicago Department of Public Health was one of the first city agencies to jump into civic hacking with the Chicago Flu Shot app.

Examples of Health Related Projects

mRelief 

mRelief is a site that simplifies the social service qualifying process with an easy-to-use form that can be accessed online and through SMS. Residents can check to see if they’re eligible for a variety of programs including food stamps, medicaid, WIC, and more.

EBT Near Me 

EBTNearMe is the easiest way to find stores and surcharge-free ATMs where you can use your EBT card in California. It was build by the Code for America Health Team because California welfare recipients pay nearly $20 million per year in ATM surcharge fees partially because there isn’t an easy way to find the free ones.

It’s an open source project built with public retailer data from the USDA and ATM data graciously shared by the CA Office of Systems Integration.

Foodborne Chicago

Foodborne Chicago uses computers & code to search Twitter for tweets related to food poisoning in Chicago. The system does as much as it can to automatically zero-in on the tweets Foodborne thinks are really about a possible food poisoning case and really coming from Chicago. Then real humans from the Chicago Department of Public Health review the tweets and @reply back to people with a link back to this page where Foodborne asks for additional information. When they fill out the online form, it becomes a 311 service request to inspect the suspect restaurant.

Chicago Health Atlas

The Chicago Health Atlas a place where you can view citywide information about health trends and take action near you to improve your own health. The site displays large amounts of data from sources like the City of Chicago, State of Illinois, and local hospitals so you can get big-picture views of health statistics in Chicago like hospital admissions, uninsurance rates, cause of death, birth rates. and drill down deep into neighborhoods to see specific information and how it compares to the city overall.

People to follow on Twitter

@lippytalk: Jake Solomon is a member of Code for America’s health focus team and spent time on SNAP benefits so he could better understand the challenges that users face.

@reedmonseur: Raed Mansour works on #publichealth tech innovations for @ChiPublicHealth like @FoodBorneChi, BU #HealthComm Faculty, APHA Member, @PurdueAlumni & @BUalumni.

@PublicHealth: Official account of the American Public Health Association: For science. For action. For health.

@CDCgov: CDC’s official Twitter source for daily credible health & safety updates for Centers for Disease Control & Prevention.


The next OpenGov Chicago Meetup: Local Court Data

opengovchicagoAt the next OpenGov Chicago meetup, set for Wednesday, June 17, 2015, we will learn about the Chicago Justice Project’s (CJP) ongoing engagement with the Office of the Chief Judge of the Circuit Court of Cook County, Timothy Evans. Here’s the description of the evening, as written by CJP’s Executive Director, Tracy Siska:

CJP’s engagement is seeking to open access to all the data created by the Court since they started collecting the data in the 1980s (the courts have told CJP they started collecting data either in 1980 or 1988). This means that when approved CJP would receive about 30 years of Court data. CJP requested all the data maintained by the Clerk’s Office on each criminal case filed, appropriately de-identified. To give you some idea how much data we are talking about here are some facts about the Cook County Justice System:

• The Circuit Court of Cook County is the largest unified court system in the US

• The Cook County State’s Attorney’s Office is the largest prosecutors office in the US

• The Cook County Jail is the largest jail in the country

This is not a onetime release! CJP is seeking an agreement that would require regular updates of court data be released on an ongoing basis moving forward removing all the current barriers to this data.

Of course, since the Court maintains ownership over the data, but does not maintain the data, the approval by Judge Evans of any request seeking access to court data is only the first step. The second step is having the data released by the Cook County Clerk of the Circuit Court, Dorothy Brown’s Office. It took CJP 27 months to get access to the 5 years of conviction data that was the basis of the Convicted in Cook Project.

CJP anticipates significant resistance from the Clerk’s Office to this request. This is the beginning of CJP’s outreach to see if we can build a community of people that will help CJP advocate for the fulfillment of this agreement.

Tracy Siska, Executive Director of the Chicago Justice Project, will talk about CJP’s efforts in more detail and what it will take to get the Court and Clerk to fulfill their request.

We’ll also cover the results of Smart Chicago’s recent PACER postcard campaign, where we helped send dozens of postcards to Chief Judge Ruben Castillo of the United States District Court of the Northern District of Illinois, asking him to look into issues with PACER , the system run by the federal judiciary that provides access to court dockets.

As part of OpenGovChicago efforts to focus on participation— thinking of government as “us” more than “them”— we are inviting hundreds of people who make up student law groups in Chicago-based law schools. If you know anyone who cares about open government and local court data, let them know about this night and register for the event here.

The City of Chicago unveils predictive analytics model to find foodborne illness faster

city-of-chicago-tech-planCity of Chicago Chief Data Officer Tom Schenk Jr spoke at last week’s Chi Hack Night to talk about their new system to predict the riskiest restaurants in order to prioritize food inspections – and has found a way to find critical violations seven days faster.

Below, we’ve put up the slides from their presentation as well as the highlight video:

The problem with the way that most cities conduct food inspections is that by law they have to inspect all of them. However, the number of restaurants far outweigh the number of inspectors. In Chicago, there’s one inspector for every 470 restaurants. Since they have to inspect them all, the normal way of doing this is random inspections. However, the team knew that the residents wouldn’t get foodborne illness at random restaurants – they would get sick from those few restaurants who don’t follow all the rules.

The Department of Innovation and Technology partnered with the Chicago Department of Public Health and staff from Allstate Insurance to see if they could use analytics predict which restaurants would have critical violations. (Side note: It’s a brilliant move on the part of the City and the Allstate to contribute volunteer hours using something that actuaries specialize in.)  Some of the data sets used to make these determinations were:

    • Establishments that had previous critical or serious violations
    • Three-day average high temperature (Not on the portal)
    • Risk level of establishment as determined by CDPH
    • Location of establishment
    • Nearby garbage and sanitation complaints
    • The type of facility being inspected
    • Nearby burglaries
    • Whether the establishment has a tobacco license or has an incidental alcohol consumption license
    • Length of time since last inspection
    • The length of time the establishment has been operating

 All of the data, with the exception of the weather and the names of the individual health inspector, come directly from the city’s data portal. (Which builds on the city’s extensive work in opening up all this data in the first place.) When factoring all of these items together, the research team was able to provide a likelihood of critical violations for each establishment, which was developed to prioritize which ones should be inspected first.

In order to test the system, they conducted a double-blind study over a sixty day period to ensure the model was correct.

The system has gotten rave reviews and coverage from a number of publications and entities including Harvard University, Governing Magazine, and WBEZ’s Afternoon Shift.

Aside from the important aspect of less people getting sick from foodborne illness in the City of Chicago, there is another very important aspect of this work that has national impact. The entire project is open source and reproducible from end to end. We’re not just talking about the code being thrown on GitHub. (Although, it is on the city’s GitHub account.) The methodology used to make the calculations is also open source, well documented, and provides a training data set so that other data scientists can try to replicate the results. No other city has released their analytic models before this release. The Department of Innovation and Technology is openly inviting other data scientists to fork their model and attempt to improve upon it.

The City of Chicago accepts pull requests as long as you agree to their contributor license agreement.

Having the project be open source and reproducible from end to end also means that this projects is deployable to other cities that also have their data at the ready. (Which, for cities that aren’t, the City’s also made their OpenETL toolkit available as well.)

The Department of Innovation and Technology has a history of opening up their work and each piece they’ve released (from their data dictionary to scripts that download Socrata datasets into R data frames) builds on the other.

In time, we may not only see Chicago using data science to improve their cities – but other cities building off the Chicago model to do so as well.

You can find out more about the project by checking out the project page here.

New Maptime Chicago Event: The Humanitarian OpenStreetMap Team!

hot_logoFor this month’s installment of Maptime, the group is going to put their OSM skills to work contributing to Humanitarian OpenStreetMap Team. Humanitarian OpenStreetMap Team (HOT) applies the principles of open source and open data sharing for humanitarian response and economic development. We will:

  • Learn about the Humanitarian OpenStreetMapTeam (HOT)
  • Get introduced to / do a quick refresher on OpenStreetMap and
  • Dive into contributing to a HOT project using the tasking manager.

We’ve featured the HOT Team before, and have been big fans of their work. If you’ve never seen them in action, here’s a short video showing their work during the aftermath of the earthquake in Haiti.

OpenStreetMap – Project Haiti from ItoWorld on Vimeo.

As you can see, HOT team focuses on mapping roads and infrastructure to help responders navigate through disaster areas.

You can learn more about how you can help the HOT Team by registering for the event here!

Event Details:

When: Thursday, May 28th, 6-8pm
Where: Chicago Community Trust (map) – 225 North Michigan Avenue, #2200. Hosted by Smart Chicago.
Contact: [email protected] or [email protected].

Smart Chicago at the Knight Media Learning Summit

knight-foundation-logoSmart Chicago’s Dan O’Neil, Demond Drummer, and Laurenellen McCann attended the Knight Media Learning Summit in Miami. The event is in it’s fourth year is specifically for community foundations, place-based foundations and media organizations looking to develop partners to bring information to their communities.

Dan spoke on the first day on a panel about entitled: KCIC Deep Dive Presentations; Design Thinking and Learning Together.

Here locally, the Knight Deep Dive supports our Deep Dive project. Previous to this, the KCIC grant supported our CivicWorks Project – a project that spreads resources and energy around the civic tech movement in Chicago.

We have four projects that fall under the Deep Dive Project:

  • On the Table – A community-wide conversation to discuss the ways in which we can commit to continue to make our communities stronger, safer and more dynamic.
  • CUTGroup – Our civic user testing group that gets real people to test civic apps. Under this grant, we will be expanding our CUTgroup program to Cook County.
  • Experimental Modes Project -A project led by Laurenellen McCann that deepens her work in needs-responsive, community-driven processes for creating technology with real people and real communities for public good
  • Unsummit: Mass neighborhood meetings centered on data and technology

Dan went into detail on our progress so far. You can catch the entire talk below – or skip to 46:02 to hear Dan talk about our work.

Immediately following Dan’s panel, our own Laurenellen McCann led a panel discussing Community, Technology and Partnerships. The panel included Demond Drummer as well as the founder of the Resident Association of Greater Englewood (RAGE) Aisaha Butler and Chicago Deputy Commissioner for Planning and Development Kathleen Dickhut.

Laurenellen went into further detail about her work with the Experimental Modes Project. Specifically, she talked about how people are not just inventing new technology but rather remixing old technologies in new ways and that the number one tactic for this work was collaboration.

Demond, Aisaha, and Kathleen also spoke about their work on the Largelots program and the role that collaboration played in developing it. The Large Lot Program is a housing land use approach that was developed as part of the Green Healthy Neighborhoods public planning process. was built to make the process of purchasing City-owned land through this program easier for residents. It was initiated by Demond Drummer while he has at at Teamwork Englewood, built by DataMade, and funded by LISC Chicago with support from the Boeing Corporation, and the Knight Foundation for LISC’s OpenGov for the Rest of Us project.

You can view the entire presentation below:

You can find our more information about the event including videos of all the panels on the Knight Foundation website.

Thoughts on the Knight Community Information Challenge: Design Thinking and Learning Together

Today I was on a panel at the Knight Foundation Media Learning Seminar along with colleagues from three other foundations, along with the Chicago Community Trust, who have formed a cohort doing work around the principles of design thinking. We’ve participated in a number of workshops and we’re sharing our deep dive with others. The hope is that we can move forward the practice of community foundations as they discover and serve the information needs of communities.

Susan Patterson, Program Director at the Knight Foundation, is moderating the panel and she sent along some prompts. This post lays out some thoughts as my primer to the panel.

At Smart Chicago, we’re in a unique position. We’re housed at The Trust, which is the actual partner for the Knight Community Information Challenge (KCIC).  The Trust provides matching funds and has been deeply invested in this work, long before Smart Chicago even existed, centered around the journalism ecosystem in Chicago. You can see the river of work that went into that here. There’s also a complete evaluation of the program: “News that Matters: An Assessment of Chicago’s Information Landscape”.

Smart Chicago has been doing work under the KCIC banner since 2012, starting with our Civic Works program, designed to spur support for civic innovation in Chicago. Christopher Whitaker has led that project for us, and it has been hugely successful, helping projects like Roll With Me (accessible transit directions in Chicago), mRelief, (a text-based way to check your eligibility for benefits in Chicago & Illinois), and. We’ve used it to give seats to innovators at 1871 and support collaboration between local government and emerging companies like Textizen.

Our current project under KCIC is the Deep Dive. There are four components; two to expand existing programs for engagement and two that are brand-new:

  • Support for the 2015 On The Table— a community-wide conversation involving more than 20,00o people in a single day
  • Expansion of the Civic User Testing Group,  a set of regular Chicago residents who get paid to test out civic apps. This has allowed us to add hundreds of testers, expand the program to all of Cook County, and conduct more tests
  • Our project on Experimental Modes of Civic Engagement in Civic Tech,led by Laurenellen McCann, which includes deep research and explication of community-driven processes for creating technology with real people and real communities
  • Lastly, our Un-Summits, which are mass neighborhood convenings around digital skills and data

One of the coolest things about this deep dive cohort is the support and structure that the Knight Foundation has fostered. There are a number of components.

We’ve gotten together, as a group, three times now to learn specific methods for design thinking— formal methods problem-solving. The best thing I’ve learned on this is interview tactics— how to find hyper-users, how to design a questionnaire, and how to conduct interviews that yield actionable information.

It’s the specific skills— not aphorisms, anecdotes, or notions— that I really value.

We’ve also done some online collaboration, which frankly hasn’t worked all that well. I’ve learned that choosing and imposing new software or processes on people never really works. It’s the genuine expressions of an organization that really make an impact. Again, that’s why I value specific modes, specific actions, that are genuine.

Lastly, I really appreciate the work of ORS Impact— the formal evaluators of our program. They’ve created a theory of change that really makes sense and pulls together a set of threads into a coherent narrative.

We look forward to continuing our work in this cohort. In fact, we’re hosting our next meeting here in Chicago in September.

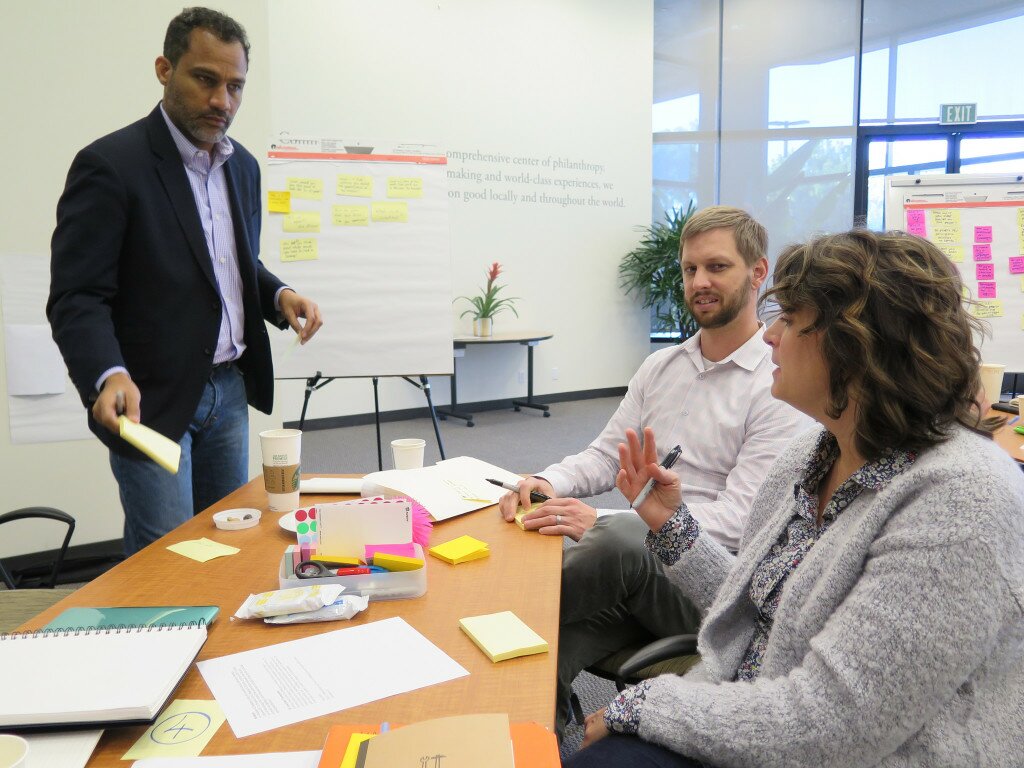
KCIC Inspiration Workshop in San Mateo, CA

KCIC Inspiration Workshop in San Mateo, CA

Here’s the panel in full:

KCIC Deep Dive Presentations; Design Thinking and Learning Together
Moderators: Susan Patterson, co-director, KCIC, Knight Foundation
Panelists: Daniel X. O’Neil, Chicago Community Trust/Smart Chicago Collaborative; Kelly Ryan, CEO, Incourage Community Foundation; Emmett D. Carson, Ph.D., CEO, Silicon Valley Community Foundation; Chris Daggett, president & CEO, Geraldine R. Dodge Foundation