CUTGroup #14 – Chicago Cityscape

CUTGroup 14 Chicago Cityscape
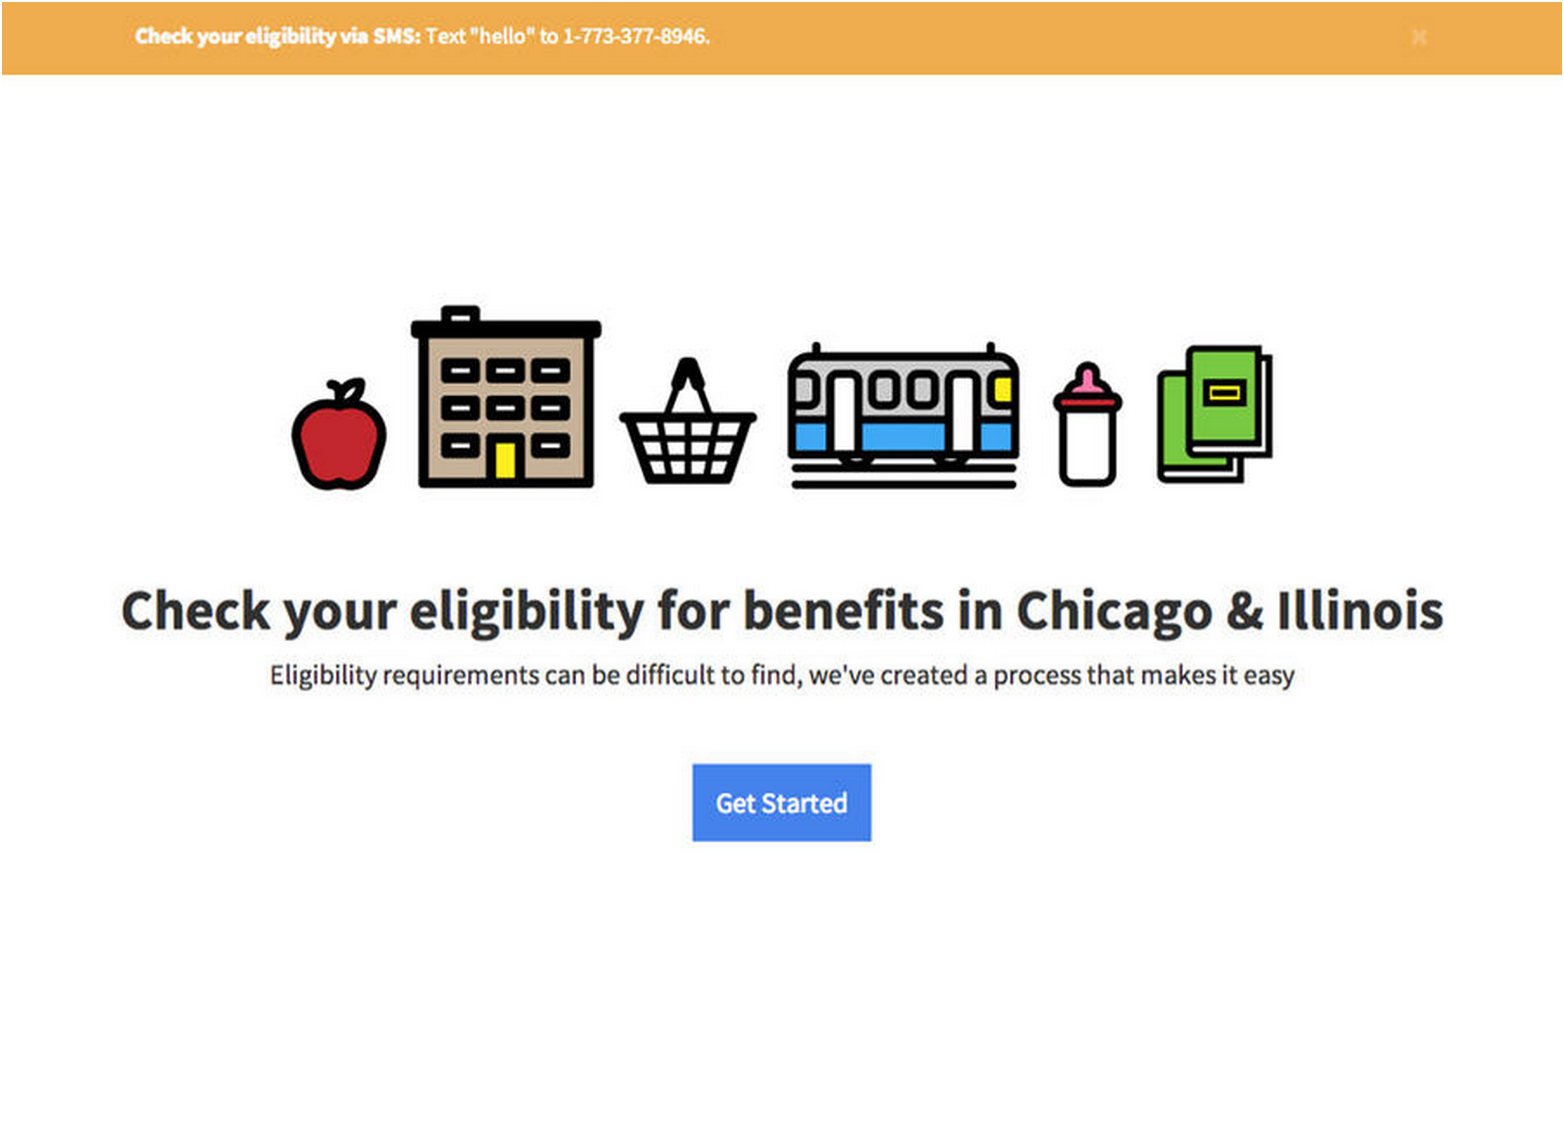
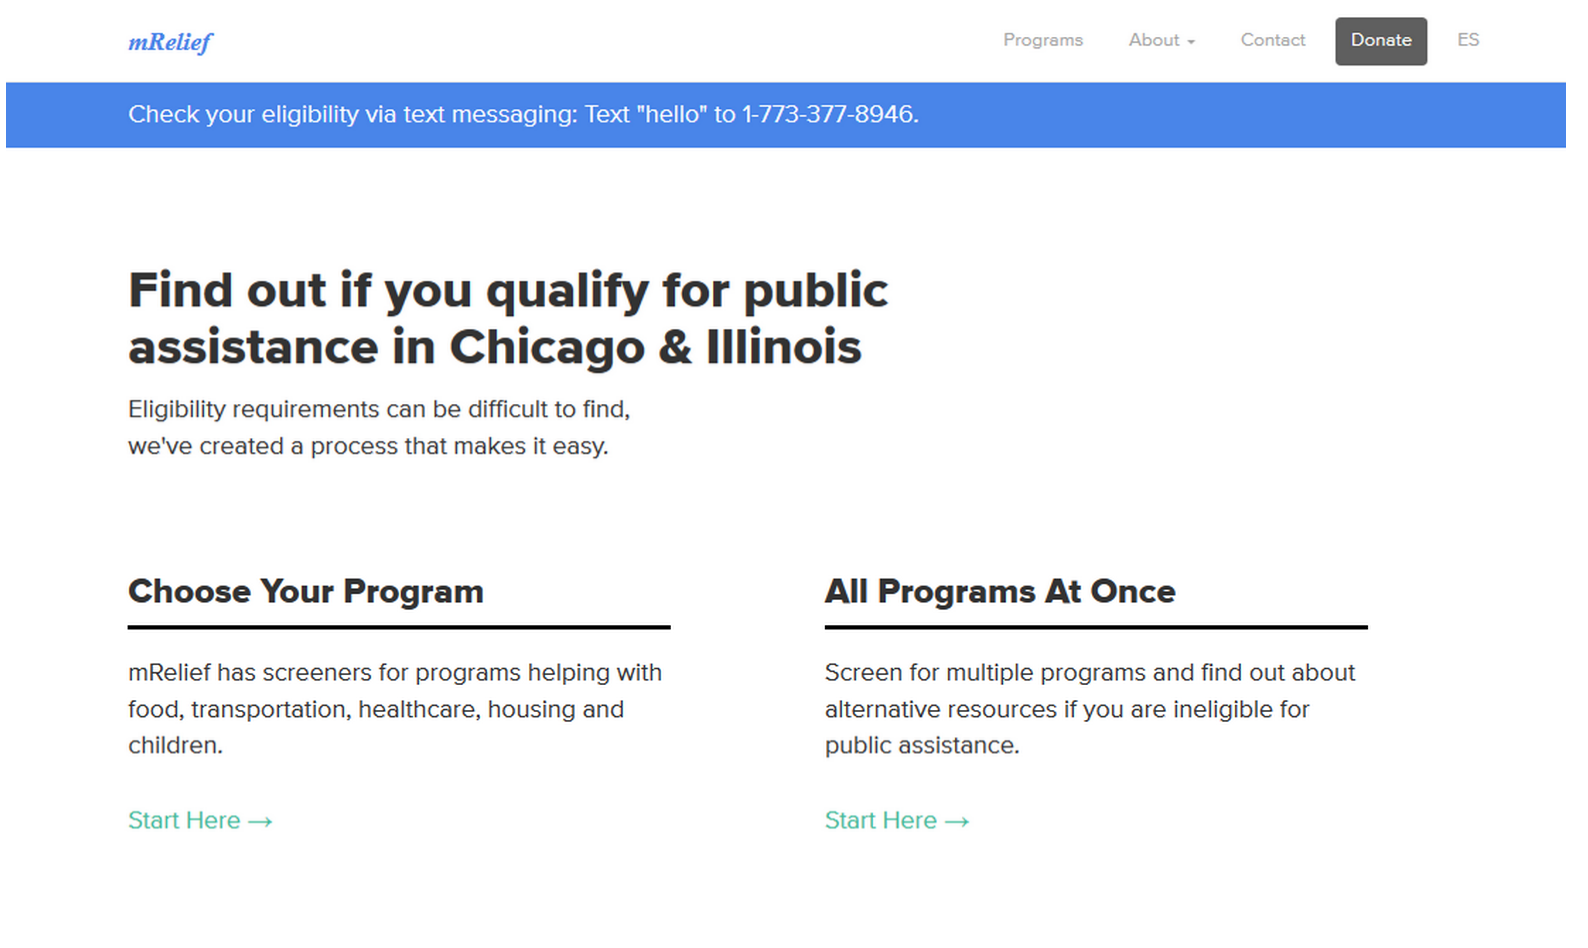
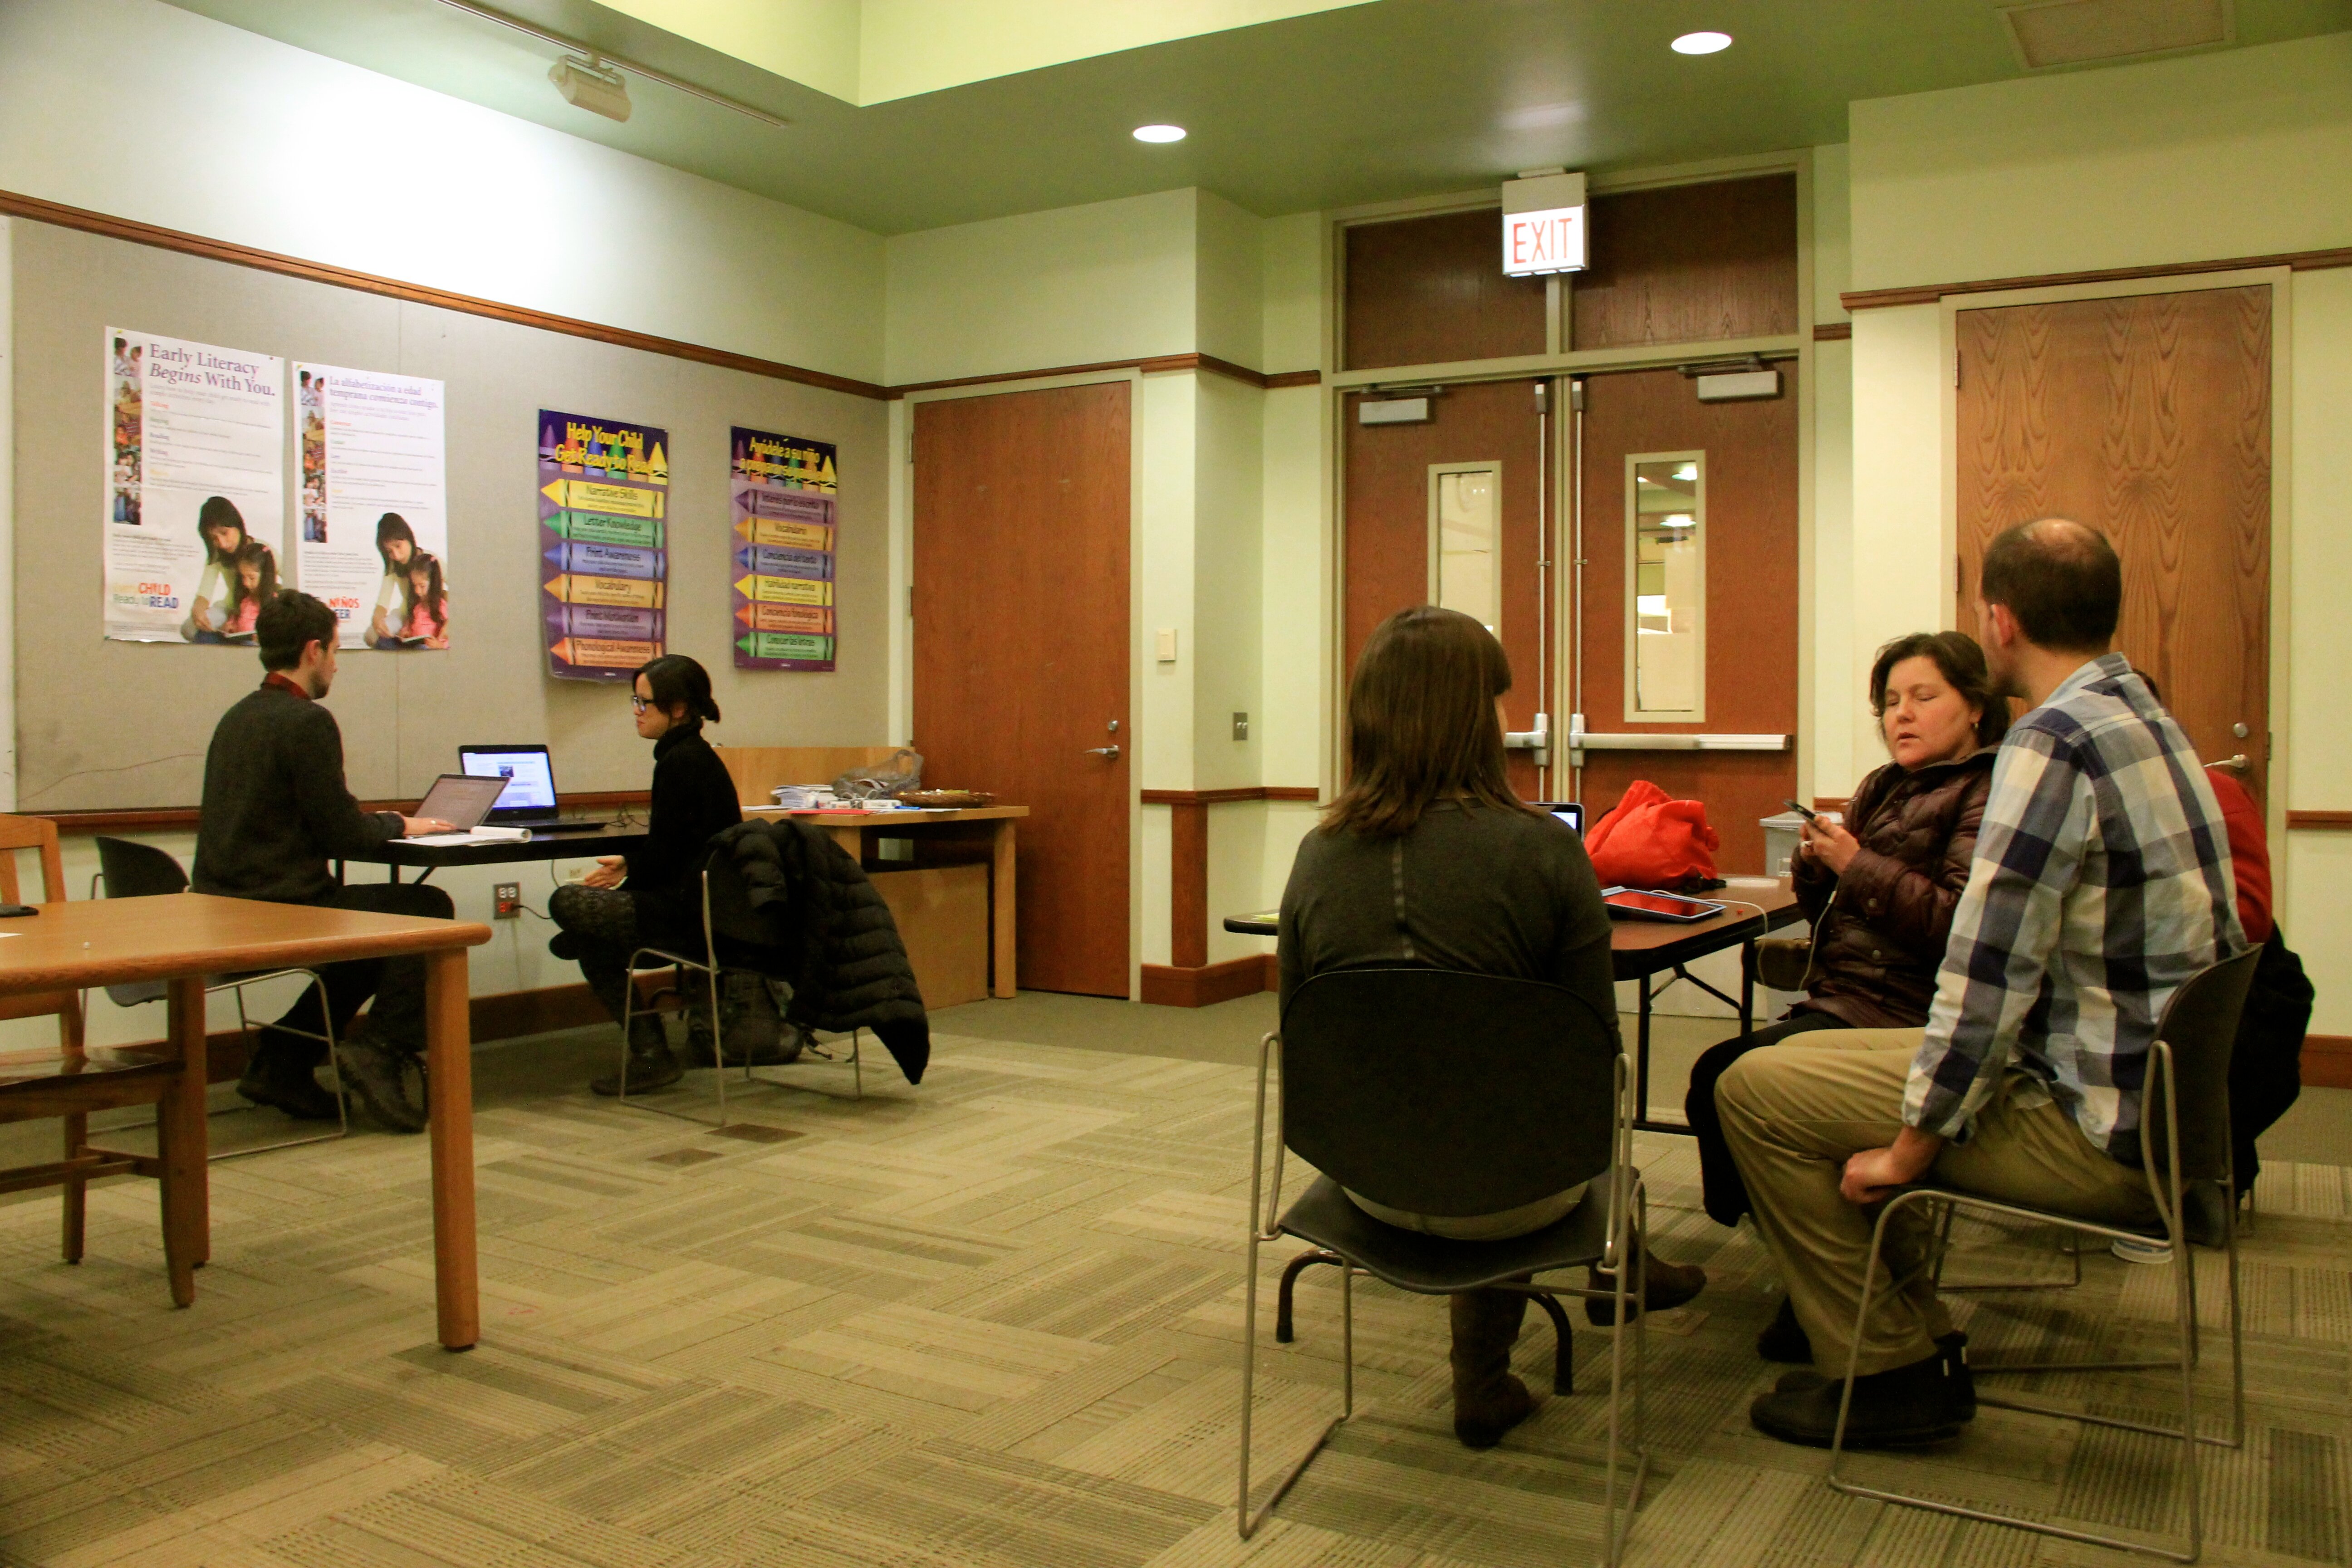
For our fourteenth Civic User Testing Group session, we tested Chicago Cityscape, a website that helps residents understand how, where, and when building development takes place in neighborhoods. This in-person test took place at one of the Connect Chicago locations – Chicago Public Library Logan Square branch at 3030 W. Fullerton Ave.

The developer, Steven Vance, wanted to learn these things from the test:

  • Usability: Are there functions that are difficult to use or provide different information than expected? What do testers look at or do first when visiting the website? In what ways can Chicago Cityscape be improved?
  • Desired features: Steven wanted a better understanding of the type of information that residents and homebuyers look for when researching neighborhoods or potential properties to live in. What are the pieces of information that residents/homebuyers most interested in? What pieces of information are they least interested in?
  • Paid Services: Is there an interest in paying for these services at a low cost?

Segmenting

On January 30, 2015, we sent out an email to all of our 831 CUTGroup participants. We wanted to know if they would be available for an in-person test on February for about 30-45 minutes. We asked some screening questions to gather information. We were interested in getting residents who are involved and care about what happens in their neighborhood. We were also looking for people who were planning to buy a home. These homebuyers did not need to be as active in their community.

We ended up having 13 testers participate in this test.

Screening Questions

We heard form 62 CUTGroup participants through our callout for testers. We received a lot of good information just from the screening questions. Here is a look at what we learned:

  • 60% of CUTGroup respondents are currently renting
  • 37% of respondents are planning to buy a home in the next year

When we asked how involved testers are in their neighborhood, this is what we they said:

5 Very Involved                     23% (14)
4 Involved                          35% (22)

3 Neutral                                 31% (19)
2 Slightly Involved                3% (2)
1 Not at all Involved              8% (5)

Test Format

The format of this test was proctored sessions with proctors working one-on-one with the testers. Testers looked at the website using either their own laptops or laptops we provided while proctors asked questions and took down their responses. It was also the first time we used the software, ZoomText, which we added to one of the laptops for a tester who has low-vision.

Ever since the Roll with Me CUTGroup test, we have been trying to reach more people through the CUTGroup. Having a diverse set of individuals, such as low vision or blind testers, helps us better understand the structure and usability a website. For example, during this test, Architect Dropout (#11) tested using iPad voice-over commands. From that experience, Steven realized that the map failed because the voice-over commands selected each map tile individually and she could not select the specific pinpoints on the map. This led to a very detailed Github issue and conversation on accessibility improvements for Leaflet. This is a goal of CUTgroup — to not only uncover user experience issues on one website or app, but to help all developers build better websites that work for everyone.

Results

Information

12 out of 13 testers are interested in learning more about what is being built or torn down in their neighborhoods, and most look to community news outlets (such as DNA Info or Everyblock) for this type of information. When learning about a property, testers said that these are the most important pieces of information: property information, tax information, neighborhood data, and violations at that specific address.

When testers were asked to search for an address in their neighborhood, most of them searched for their home addresses and called out these pieces of data on the “Address Snapshot” page: demographics, Aldermen/ward information, property taxes, crimes, and then permits. While there was not a one-sided response to the “least useful information” question, a lot of testers had questions about the data they were seeing on the pages. Here are a couple of ways that testers would improve the Address Snapshot page:

  • Change up the design elements: 5 out of 13 testers mentioned changing elements of the color and design as ways to improve the Address Snapshot page. HomeSweet (#12) says, “Visually the page is rather simplistic and not in a way that makes it easy to read. It’s not immediately clear that the ad is an ad.”
  • Highlight or change information structure: 3 testers thought that information on the pages should change and different pieces of information should be highlighted. Testers also mentioned that there was a lot of information on these pages, and it would be better if they were organized with better definitions and descriptions.

When looking at the permit information, testers had an easier time navigating the permit information on the map versus the information listed on the community or neighborhood area. Testers again had a lot of questions about the data they were looking at, here are some examples:

“Are these permits already approved?” –Big on Community & IT Field #geekchic (#3)

“TIF district! I want to know what that is” –Non-Profit Pro (#6)

“What’s to be gained by showing the total estimated costs of the projects? What does change time mean?  How do you get access to the records? Do you have a way to get it quickly?” – Construction Watcher (#2)

83% of testers thought that the permit information was useful or interesting. Two testers wanted to compare permit data in their neighborhood to other neighborhoods. In addition, one tester, Chicago Explorer (#10), thought that seeing the history of the neighborhood through permits is interesting. If she was starting a business or looking for a property it would be especially useful.

Usability

For the most part, testers found it very easy to navigate the website. There was some confusion when ads had a light background and matched Chicago Cityscape. In addition, testers had questions about the map icons and had questions about the data types or the timeline of what was being displayed.

When first exploring the website, most testers did not an overwhelmingly clear first step or action. 4 out of 13 testers (31%) viewed or clicked on the map on the homepage, 3 testers (25%) typed in an address, while the rest of the testers did a variety of other first actions. In addition, when testers were first reviewing the homepage, 5 out of 13 testers (31%) were not clear who the audience was.

Audience

Throughout the test, testers mentioned useful and not useful information on every page and often distinguished which information would be useful to one group but not to others. As mentioned before, testers had questions about the audience ever since the start of the test.

Architect Dropout (#11) says, “It doesn’t seem super targeted to your average Jane, seems targeted to a business, not very consumer targeted… doesn’t seem to want to sell me anything, feels more like an industry site.”

Both HomeSweet (#12) and Big on Community & IT Field #geekchic (#3) said that they thought this was a real estate/homebuyers website.

Chicago Explorer (#10) and First time looker (#9) both mentioned the paid subscriptions on the “Find Permits” community or neighborhood pages. First time looker (#9) thought the paywall in the description stifles here curiosity. She hasn’t used it enough to make a decision – there is no information on a trial readily available, no free content on the outset, which turns her off because she doesn’t even know if it’s valuable to her yet. Chicago Explorer (#10) added that “Subscribe– doesn’t appeal to me, but would if I were a mogul.”

Chicago Cityscape has a great opportunity to teach residents about building/property information and permits and then provide a platform for residents to learn more about what is happening in their own neighborhoods. The best way that can happen is to continue to include definitions and descriptions of terms.

It is also important to consider audience for this website and provide the proper pathways for individuals to get the information that they need. Whether they are an involved community member, home buyer, or a contractor. Defining the purpose of this site and how this data is useful to multiple groups of people in the forefront (on the homepage) will give individuals the grounding to use the data provided.

Final Report

Here is a final report of results with the analysis of the questions we asked, followed by each tester’s responses, and copies of other questions we asked:

The raw test data can be found below with the answers from every tester:

Chicago Hospitals Win $8.75 Million to Launch Data Network

A data-sharing network of 10 Chicago hospitals could make medical research more reliable and less expensive. It’s a big-data project that keeps patients records locked up, but lets researchers search for trends.

An $8.75 million grant will fund the three-year launch of the Chicago Area Patient-Centered Outcomes Research Network. Awarded July 21, the contract taps money set aside in the Affordable Care Act for medical research.

Terry Mazany

Terry Mazany, The Chicago Community Trust

“What’s unique about CAPriCORN is that it brings together these 10 institutions that historically have been competitors, or at least disinterested in each other,” says Terry Mazany, chief executive of The Chicago Community Trust and the project’s principal investigator. (The trust is also a Smart Chicago funder.)

“This brings them together in a very formal organization across the entire region,” Mazany says, “with a patient population of upwards of 5 million patients potentially available for research, and in particular a patient population that is very diverse.”

The Chicago network and clinical networks in 10 other regions will allow health advocates to monitor even rare conditions and prove how well current treatments work.

Their first test will be Duke University’s nationwide study to prove whether taking children’s aspirin to prevent a heart attack is as effective as an adult dose, which carries potential side effects. Researchers in Chicago and five other cities will study 20,000 at-risk heart patients, a large sample size that allows fine-tuned analysis.

Richard Kennedy, Loyola University Chicago

Richard Kennedy, Loyola University Chicago

“They contacted us and said, you’ve got the numbers that we need, would you be able to participate?” says Richard Kennedy, vice provost for research and graduate studies at the Loyola University Chicago health sciences division in Maywood. “We had a significant number of patients that would fit nicely in the cohort.” Kennedy and Frances Weaver are Loyola’s head researchers for the data network.

Hospitals now are collaborating on how to conduct the trial and manage the data. Other studies will track obese patients after bariatric surgery and children on antibiotics to treat immune disorders. Mazany sees Chicago hospitals as active participants. “When the national level is looking at need and expertise in an area, we have a far broader and deeper bench than any of the other systems,” he says. “That’s a real strength.”

In a $7 million startup phase, CAPriCORN built out a system to connect the medical centers without exposing patient information. The next phase explores its real-world uses, as well as a funding model that puts patients’ interests first.

The aspirin study “is going to answer a question of great clinical concern,” Kennedy says, “but the importance is truly we’re testing the infrastructure we’ve been building for the past 18 months. All right, you’ve put together what seems to be a very impressive informatics system with all the security we would want for our patients. Now let’s see if it works.”

Privacy starts with keeping personal identifiers off the network. Researchers query data in a small, separate access layer, with names and addresses reduced to a cryptographic hash. “We’re currently having it validated by a security firm that’s one of the top in the region to make sure it protects subjects,” Kennedy says.

A novel algorithm links the anonymous patients’ records across all hospitals, giving public health researchers a more reliable count of how common their condition is and where to find hot spots. “You have the ability to look for rare diseases and aggregate an adequate sample size to do statistically significant studies,” Mazany says.

“There’s a next step in some of the research designs,” he adds. Instead of just counting how many patients share a condition, studies that pass an ethics review will reach out to them.

“Let’s say you’re looking at exploring treatments for sickle cell, and you’re specifically looking at teenagers as a population,” he explains. “Then you can do a query to identify the total population and where they’re distributed among institutions.”

Hospitals then can ask patients to join clinical trials that will log treatment details. “It still protects patient privacy but is able to more efficiently identify candidates for the research study,” Mazany says.

Researchers see the network as low-cost way to recruit trial subjects. “Instead of tens of thousands of dollars per participant, then it’s dollars per participant,” Mazany says. “You leverage the efficiency of large data systems so each researcher doesn’t independently have to enroll institutions.

“What makes this in someone’s interest? Lowering the cost of research, speeding up research, creating greater effectiveness. Those three standards are part of a health system that’s learning and evolving rapidly.”

The focus likely will improve data handling as well. “One interesting byproduct could be if there is unevenness across institutions that may become apparent,” Mazany says.

Research on the network will be subject to more thorough advance review. “It’s patient centered,” Loyola’s Kennedy says. “It includes a lot of patient input into the design of the study, the importance of the study to the subjects, the patients, the community.”

Like other clinical trials, research must pass muster with an institutional review board. Feedback also comes from a doctor-patient advisory panel that includes advocates for treating asthma, arthritis and other diseases.

“There’s also a pastor’s group on the South Side that’s very active,” Mazany says. The advisory group “totals about 30 people — it’s a pretty large group.”

The extra review should put important research on a fast track, and prime doctors and patients to follow its recommendations.

“Oftentimes research truly answers medical questions for the people that ran it, yet the results don’t get distributed and implemented as well as we would like,” Kennedy says. “We hope that by engaging the community and the patients – and the clinicians who are taking care of those patients – the results will be implemented much more quickly, because they will be designed in part by input from these subjects.”

The aspirin study also will look into the benefits of mobile health devices. A University of California-San Francisco team will give some participants apps to send reminders and record activity. In Chicago, Kennedy says investigators are considering how they might manage frequent readings from blood sugar monitors in a diabetes trial.

The network is “more open and accessible for that type of data collection,” Mazany says. “Who knows where that will lead as far as the efficacy of the research?”

Hospitals will have to consider a long-term funding model after federal funding runs out in 2018. “We’ve been contacted by an industry sponsor, who would very much like to think that there was a Chicago network they could access without working individually with the 10 institutions,” Kennedy says “That’s going to take some time to create that kind of trust.”

Mazany wants to make sure patient advocates can propose research on the network, but they’ll need to be thoroughly vetted. “They’ll come up with their own queries, but there won’t be an open-data hack night,” he says. “There are just too many privacy and security concerns with these types of data. But in a sense, the hack night would be communities and patients identifying questions that could interrogate data sets through the mechanism of the queries.”

The network has no data portal, but researchers will be encouraged to find ways to show their work outside of medical journals. That may include websites such as Smart Chicago’s Chicago Health Atlas, a past collaborator with hospital networks.

“The Health Atlas is an example of a good partner both on the front end of identifying important trends in the data that can help to frame priorities, and then on the back end as a distribution system for communications outward,” Mazany says. “I look for the Health Atlas to be a very valuable partner, but none of this has been formalized.”

The big-data approach also might spread beyond hospitals. “I don’t know how that’s going to play out,” Mazany says. The network already includes community health centers that store electronic health records centrally. He envisions opening up the network to more health providers.

“That line of thinking is an exciting frontier,” Mazany says. “Right now everybody is up to their necks in alligators draining the swamp. The analogy with Walt Disney envisioning Disney World and Florida in the midst of the swamp I think is appropriate here. We have a vision and are laying the infrastructure to have arise a Magic Kingdom.”

Community Health Workers Teach Asthma Patients to Breathe Easier

Kimberly Artis, community health educator

Kimberly Artis, community health educator

When an asthma patient showed her inhaler, Kimberly Artis was encouraged, at first.

“She shook the medicine up and I’m thinking in my head, OK that’s good,” says Artis, a community health educator with Sinai Health System in Chicago. “The next thing she did was take a cleansing breath, and I’m like, that’s even better because most people don’t do this.”

Then the patient sprayed the inhaler over her shoulder and took a breath of the room air, and Artis knew why this patient wasn’t getting better. “If the doctor asked her if she was taking her medication, she would have said yes, because she thought she was doing it correctly,” Artis says.

Artis was hired to help patients in their own homes, and to keep them out of emergency rooms. Outreach workers like Artis have helped Sinai cut return visits. Sinai, which includes Mount Sinai, Holy Cross and Sinai Children’s hospitals, estimates the visits save $3,200 per patient, more than $5 for every dollar spent. Now the technique is spreading to treat other environmental health conditions in underserved neighborhoods.

Asthma affects 9.1 percent of Chicago adults, compared with 8 percent nationwide. It’s one of the top 10 reasons Chicagoans land in the hospital, with 7,325 hospital cases in 2012, according to a Chicago Department of Public Health analysis of state records.

“We’ve been working to address asthma disparities in the communities we serve on the West Side of Chicago since 2001,” says Helen Margellos-Anast, Sinai’s senior epidemiologist and asthma program director. “We focus on helping people understand what asthma is, recognizing it early in its trajectory – understanding these are the early symptoms, and I have to treat them now.”

Continue reading

Download the Entire Youth-Led Tech Curriculum Set: 29 Days / 174 Hours of Training; Available for Free in One Click

Daniel Ash addressing Youth Led Tech“Youth-led Tech | Summer 2015” was a technology mentoring program in five Chicago neighborhoods: Austin, Englewood, Humboldt Park, North Lawndale, and Roseland.

We love to share our work so here’s a PDF version of the entire course. We cover introductions to WordPress, WordPress dashboards, themes, how to post, how to make an app, financial literacy, and how to add media to your WordPress site. We also have set time aside each day for students to work on their typing skills. 29 separate days, 174 hours, dozens of lessons— the ability to start your own summer tech class— all in one click.

These files are an hour-by-hour, step-by-step guide for anyone who wants to run a similar program anywhere in the world. We show start/ end times, materials to use, planning notes, and the exact words you can use to lead your own sessions. We also have set time aside each day for students to work on their typing skills. Lots of the material is pulled from other sources, with attribution, and we include hard copies of handouts created by others. Many of the ice breakers and team-building activities are the standard “greatest hits” of youth work, but this is the first time that this material was put together into this format.

We expect you’ll want to modify these files for your own use, so we also have the entire course in Microsoft Word format. If you are just interested in a specific topic or a jumpstart for your own work, we offer individual days for free download and use as well.

The main author of this course is our consultant, Chris Rudd.

The Civic User Testing Group and Other Listening Strategies

Note: this is a guest post by Rose Afriyie of our partner mRelief.

How do you keep your finger on the pulse of user needs? At mRelief.com, a startup with non-traditional users — beneficiaries of public assistance — this is a question that we constantly ask ourselves. We are helping our users solve for long wait times by providing them an avenue to help them assess their eligibility for public assistance through text messaging conversations and online questionnaires that help them gauge whether it is worth it to complete extensive applications. These forms return response pages and text messages that help them determine their eligibility and local resources through a partnership that we have with Purple Binder.

Our users don’t have a lot of economic power in society. An average online mRelief user is paid $1,321 a month and those who text in to determine their eligibility make $150 less in earned income. When you have decreased purchasing power, technology is seldom built with your needs in mind. But in interviews and surveys, our users have shared that they are humbled by our willingness to learn how we can better serve them and provide relief to the process of asking for government help.

Since we launched in September last year in Chicago, we had to commit to some listening strategies— activities we engaged in to hear our users and meet them where they are. Considering that we had 134 percent online user growth between May and June  and that between June and July we almost tripled the number of text messages processed by our system, we think we are on to something. We would love to share one key listening strategy that contributed to getting us to this point: The CUTGroup.

Landing Page Before CUTGroup:

mRelief Homepage before CUTGroup

Landing Page After CUTGroup:

mRelief Homepage after CUTGroup

Civic User Testing Group (CUTGroup)

Since we launched mRelief, we conduct quarterly user surveys to get a sense of what makes our users tick. In 4th quarter of last year, the revelation was 82 percent of respondents didn’t pay for SMS which gave us the affirmation needed to launch our SMS strategy in November 2014.

But the most in-depth survey by far has been the CUTGroup test we participated in during Q1 of this year, an initiative from Smart Chicago to to help developers listen to the needs of their users. It combines observational analysis with insightful questions through surveys.

CUTGroup insights on our website usability combined with Google Analytics data on form completion and bounce rate were catalysts for redesigning our entire site with key leads on what should be areas of focus. Especially helpful was the notion that our icons on our pre-CUTGroup landing page were not clearly understood by 4 out of 6 of the users who mentioned our icons.

Other features that were the result of usability feedback led to rethinking our calculator by positioning a link to it near income questions and making all popovers/help text pop out as soon as a user enters data into a field. Based on typos, resulting from auto-correct and human error, we also revamped our SMS experience with more notices and additions that left users feeling like they weren’t penalized for mistakes. We helped users who texted in stay on the same text message if they made an error– all made possible through observational analysis in the CUTGroup.

Golden Nuggets for Future Consideration

I live 8 minutes from the Martin Luther King Community Service Center where we launched our first pilot involving case workers who served as navigators for our tools. There are times, on my way to work, that I will stop in and just wait with the folks we serve. I will listen. Observe folks — the phones they use, the questions asked about eligibility and surmise what the growing pain points are. For many startup co-founders, in-person surveys are time-intensive and are an “and” strategy combined with other world wide web magic. So, I also want to share two dope insights that we hope to integrate into listening strategies for the future:

  • Feedback Questions Integrated Within Your Tool – Cathy Deng at Data Made, a designer and developer we adore, has a listening strategy that integrates instant feedback on the tool itself. One contribution she made to the recently announced chicagosmilliondollarblocks.com was a feedback question seen here:

golden nugget

  1. Analytics, Analytics, Analytics – For those whose technology solution is primarily on web, listening with cutting edge analytics services is also crucial. Keen.io is one analytics as a service tool and Heapanalytics.com automatically captures hovering, scrolling, clicking and more that a user will engage in on your site.

So chime in, folks, tell us how are you listening?

See how we have integrated learnings into our site at www.mrelief.com

mRelief is also currently looking to pair with folks who have expertise in Angular JS. E-mail us at [email protected] if you are interested in supporting tools that modernize public benefits for all.