Announcing the October 18th Array of Things Public Meeting at Association House

Continuing the Array of Things Civic Engagement Work from 2016, we’re pleased to announce a new public meeting on Wednesday, October 18, 2017:

Event: Array of Things Public Meeting

Date: Wednesday, October 18, 2017

Time: 5:30pm – 7:30pm

Location: 1116 N Kedzie Ave –Association House. Note that the meeting will take place in the 1st floor cafeteria.

RSVP: Learn more and confirm your attendance at bit.ly/1018aotmeeting

This is an open meeting. Everyone is invited and no knowledge of technology or sensors is required to be a welcome, meaningful addition to the event. Though we’re collecting RSVPs online, not that walk-ins are very welcome — we’re just asking for RSVPs to assist us with estimating food.

This meeting is hosted by the Association House, a vital community anchor institution and local leader providing essential educational and workforce development services everyday. According to their website:

Since 1899, Association House has worked with Chicagoans who seek tools to lead more productive lives. It is one of the oldest “settlement houses” in Chicago originally designed to provide relief and guidance to new immigrants. Today, Association House is a vital resource to under-served, multicultural communities, providing collaborative programs in English and Spanish. We promote health and wellness, educational advancement, and economic empowerment. With a staff of over 200 professionals, Association House impacts the lives of nearly 20,000 children, individuals and families each year in the neighborhoods of Humboldt Park, West Town, Logan Square, Avondale, Hermosa, and beyond.

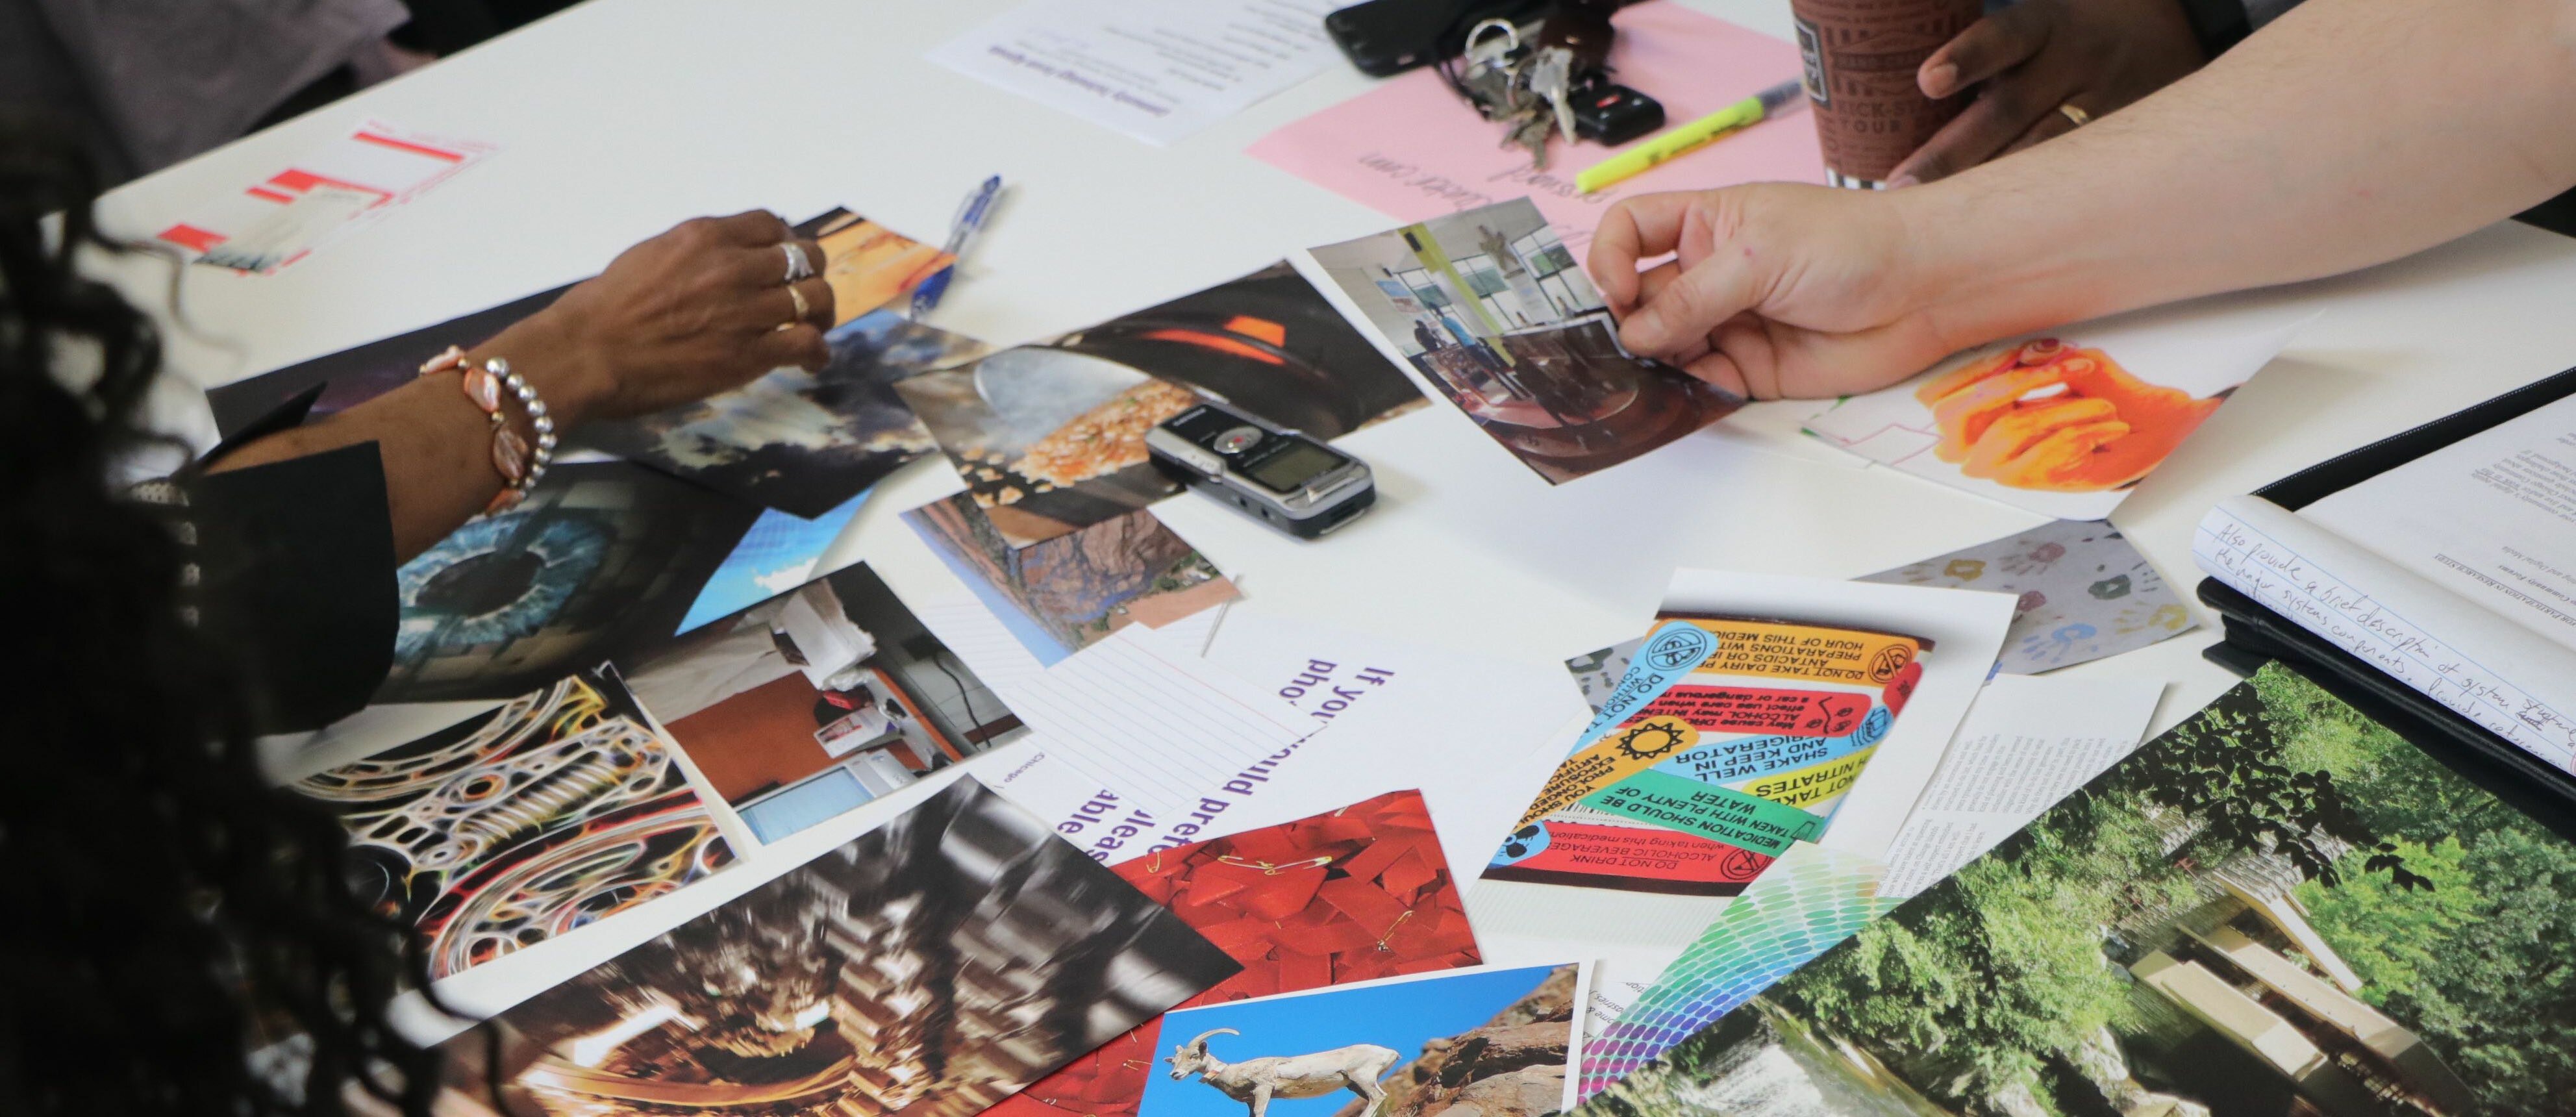
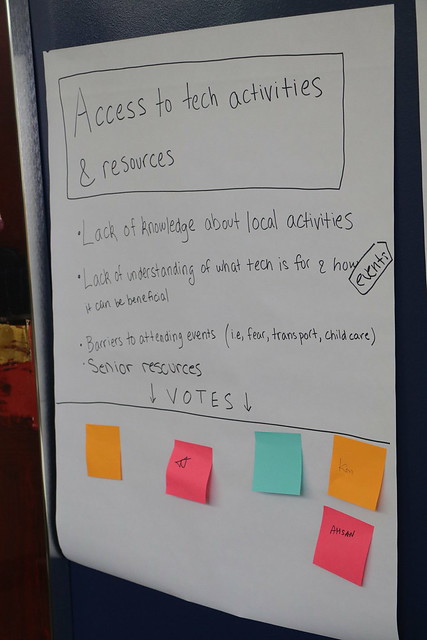
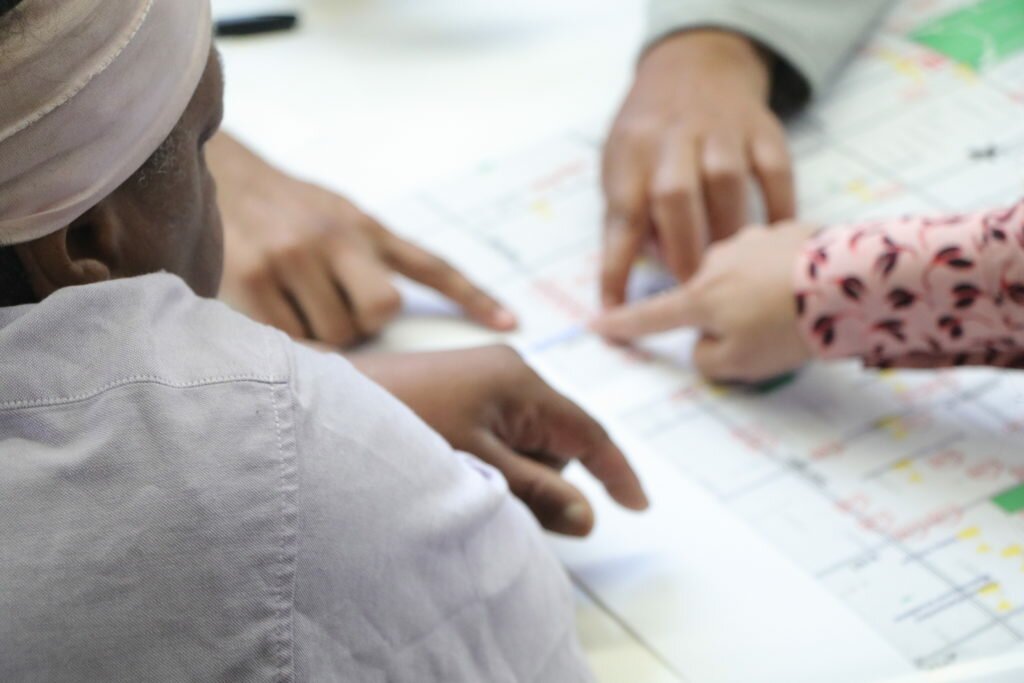
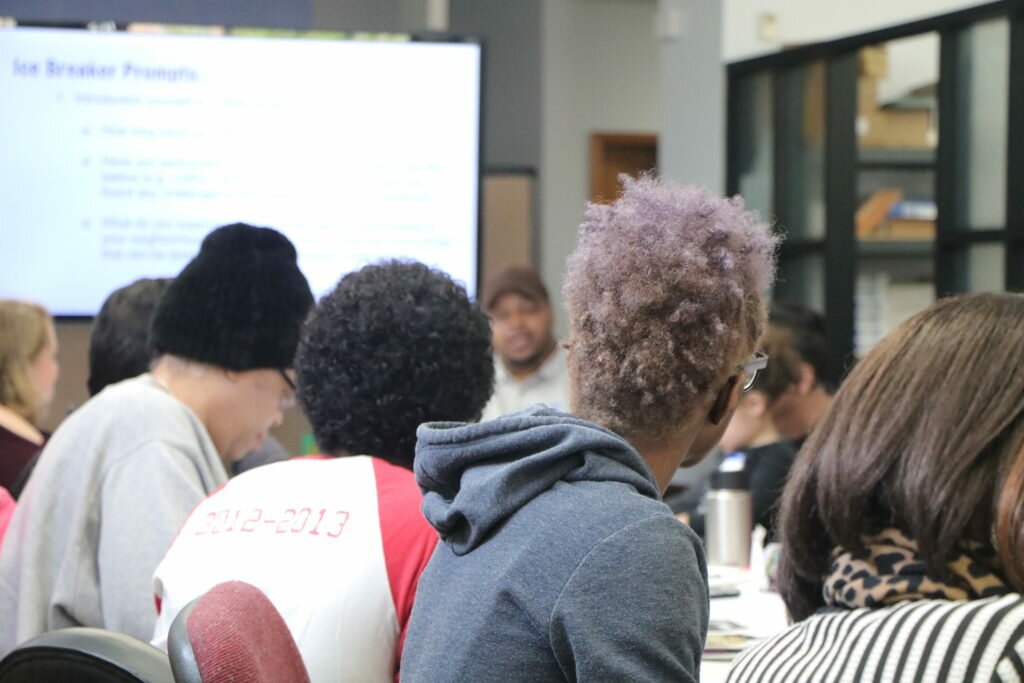
Given Association House’s leadership and history, we’re so pleased that they are hosting this important civic conversation about how new technologies can be informed by residents and advance local goals and quality of life. The Array of Things project is a collection of multi-purpose sensors that will collect data about the livability factors in our city like air quality, noise pollution, and flooding. These data will fuel new research about Chicago neighborhoods.

Here is the flyer for this meeting:

10/18/17 Array of Things Public Meeting Flyer from Smart Chicago Collaborative

The purpose of the 2017 Array of Things Public Meetings is educate the public on the Array of Things project and host neighborhood level conversations about hyperlocal research priorities and partnerships. This engagement work began in 2016 with resident-driven conversations about how smart city technologies can be governed and leveraged to improve our communities. You can read more about our goals and model for this civic engagement work here.

If you are interested in attending the Array of Things Public Meetings or would like to receive updates about the projects as well as information about future events or trainings, please fill out this form:

Fill out my online form.

The Array of Things Project is also soliciting community suggestions and ideas about sensor placement. If you would like to submit your idea, make sure to fill out this form on the Array of Things website.

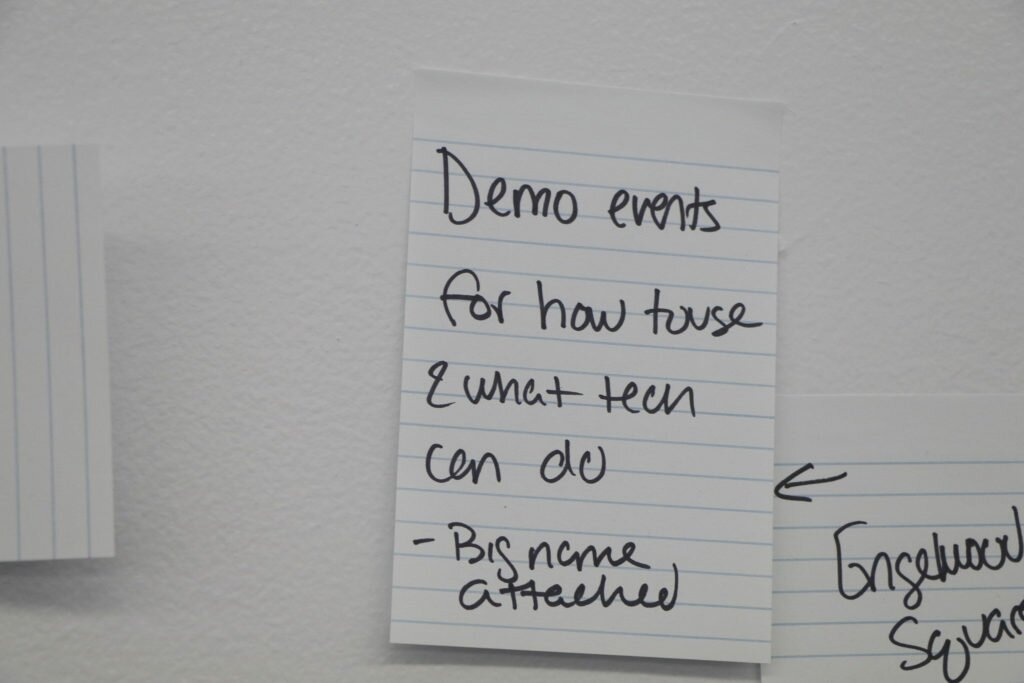
Photo from the 2016 Array of Things Public Meeting at the Lozano Public Library

Announcing the June Connect Chicago Meetup: Empowering Girls Through Technology

At the next Connect Chicago Meetup, we’ll have a roundtable discussion led by a panel of trainers and nonprofit representatives that work every day to leverage tech training to improve the lives of girls and young women across Chicago.

Special guests that will share their work and help us discuss this topic:

• David Lane, YWCA Chicago

• Asia Roberson, Digital Youth Divas

Here’s the event information:

Event: Roundtable Discussion: Empowering Girls Through Technology

Where: The Literacenter — 641 West Lake St. (read more about Literacenter here)

When: Friday, June 9th from 11am to 1pm

RSVP here.

Come join the conversation and help fuel an equitable tech ecosystem in Chicago. Meet and network with computer trainers, nonprofit professionals, technologists, community advocates, and fellow residents who care about digital inclusion in Chicago. Please RSVP on Meetup so we can get an accurate count for lunch. Thank you!

The Connect Chicago Meetup is a monthly gathering of computer trainers, nonprofit professionals, and fellow residents who care about the digital lives of Chicagoans. In 2017, Meetups will be held downtown and some events (called Community Technology Forums) will be held at community learning & nonprofit sites across the city. Email me at [email protected] with any questions, concerns or ideas for future Connect Chicago Meetups.


Designing Meaningful Civic Interactions with Data

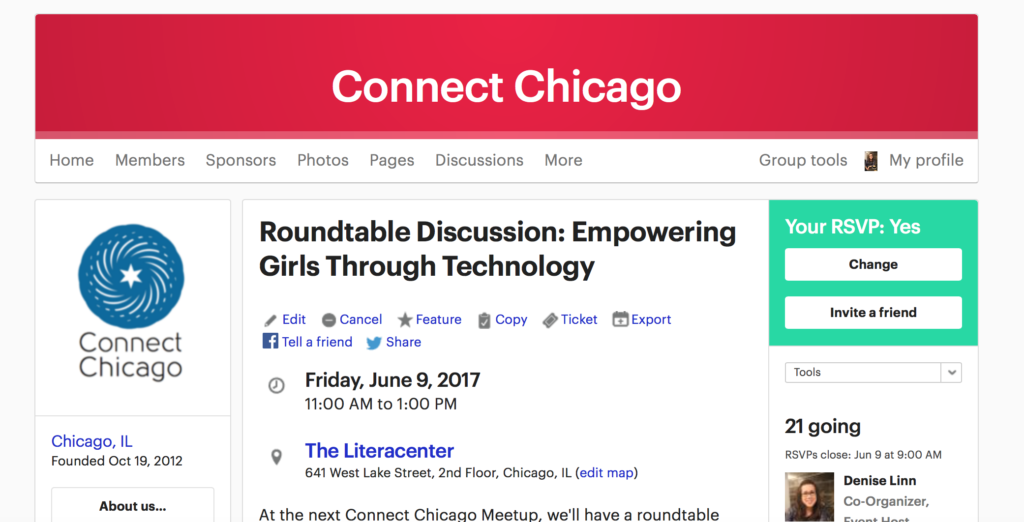
This blog post is by Mark Díaz, the Smart Chicago Collaborative’s graduate fellow from Northwestern University’s Technology & Social Behavior PhD program. Mark is assisting with Smart Chicago’s collaborative data work, supporting efforts in data-driven journalism and advocacy.

Many tools aim to synthesize large amounts of data into engaging and digestible forms. Flashy infographics and interactive data tools can be found in advertisements, in news, and in educational settings. They bring to life static visualizations by letting users manipulate what they see— from zoomable geographic maps showing detailed landscapes and terrain to bubble charts summarizing data breaches, users can discover more information and rich stories  in a single, interactive data tool.

Introducing interactive elements to a data tool, however, risks potential information overload. With more data to digest, highlighting the most important components and allowing the user to step through information at a comfortable pace becomes a challenge. Because interactive visualizations can take many forms, there is no single way to design an elegant user experience. One way to counteract information overload is to construct a narrative within an interactive data tool. These engaging tools are designed for specific users and designed for those users to leave with specific takeaways in mind.

Given my background in design and my emerging interest in civic tech and data engagement, I wanted to highlight a crop of tools that I think offer engaging experiences driven by both interactivity and narrative flow.

Tools that check our assumptions

The New York Times regularly puts out interesting charts and infographics on a variety of topics. In particular, their You Draw It series features interactive graphs depicting various trends, including the effect of Obama’s domestic policies and the relationship between family income and children’s college prospects.

What sets these interactive data tools apart from others is the fact that the user has to complete unfinished graphs with their own guess before they can see the real data. The tools do a great job of forcing the user to take a few seconds to think about their perception of the world and, in doing so, check their understanding. The graphs then present the real data in comparison with user’s guesses.

Some of the You Draw It graphs will even tell you how your guesses compared to other people’s guesses. It might be tempting to give the facts of an often misunderstood story upfront, but hooking users by leveraging their own perspective can help them think carefully about the data they are seeing.

Tools that address the “so what?”

A lot of data tools and visualizations out there are interesting and fun because of unexpected or funny data. Maps showing regional slang terms or the richest person in each state can offer some fun surprises, but, not all data will seem equally personal or relevant to all people. More importantly, sometimes it can be difficult to connect the data in a visualization to what it means for an individual and their community. The Use of Force Project features extensive information about use of force policies in different police departments along with a 12-page report on the relationship between these policies and police violence. Before getting to the data tool, the site presents the user with a thesis statement and concise bullet points framing why use of force policies deserve attention.

The website has a plethora of information, yet it’s easy to walk away with the main idea and argument. Online, the most valuable currency is attention and a compelling “so what” can hold attention a little longer.

Tools that address the “what now?”

Our States is a nifty site created by StayWoke, a nonprofit dedicated to supporting data, design, and policy-related projects pursuing equity and justice. The OurStates website leads with a mission of challenging policies endorsed by the Drumpf administration. When first landing on the page, the user is met with why the tool exists and is presented with an expansive interactive map. The map is rich with information about policies both in harmony with and opposed to President Drumpf’s political platform.

The tool foregrounds civic engagement and gives information on specific action that users can take to support or challenge legislation. The tool gives an overview of legislation across the country while simultaneously allowing users to home in on their own state. A downloadable guide sits just below the map and complements newly learned political knowledge with political action. The site makes it straightforward for the curious user to take next steps toward channeling energy into civic response.

The tool foregrounds civic engagement and gives information on specific action that users can take to support or challenge legislation. The tool gives an overview of legislation across the country while simultaneously allowing users to home in on their own state. A downloadable guide sits just below the map and complements newly learned political knowledge with political action. The site makes it straightforward for the curious user to take next steps toward channeling energy into civic response.

Designing with a narrative in mind

Ultimately, each of the data tools above communicates clearly to the user. These aren’t just standalone tools. They are imbued with different perspectives and, just as an essay helps you think through arguments and ideas, so do compelling data tools. Rather than simply display new information to the user, they compel the user to learn, reflect, and sometimes act. When thinking about advocacy and civic engagement, strategic design starts with a few simple questions: Who do I want to use this? Why do I want them to use this? What do I want to happen when they use this? What do I want to happen after they use this? Great data tools will, in one way or another, supply users with the answers to these questions. Data tools offer an informal space for civically engaging users and helping them become better social critics.


Documentation from the Community Technology Forum at Greater Southwest Development Corporation

We’ve compiled the public notes and pictures from the April 22nd Community Technology Forum at the Greater Southwest Development Corporation (GSDC). This public-facing documentation will be followed up with a more detailed report from our partners at DePaul University who are presently analyzing and organizing the ideas generated by residents.

Community Technology Forums are participatory design sessions facilitated by Sheena Erete and Jessa Dickinson from the College of Computing and Digital Media at the DePaul University, hosted by leading local technology changemakers like GSDC, supported by Connect Chicago and Smart Chicago, and fueled by resident voices. So many conversations about technology happen in the Loop everyday — we’re pleased to work with so many people and partners to ensure that community-directed conversations about technology are elevated as well.

Pictures from the event are posted on the Smart Chicago Flickr account.

GSDC Community Technology Forum

Here is an agenda from the event:

We’ve compiled some of the documentation from the event in this Google Folder, a subfolder of the larger Connect Chicago Meetup Folder which houses even more resources and material from digital inclusion events. You can see some of the community maps and handouts we used at the Community Technology Forum in that Google Folder.

We also partnered with the City Bureau Documenters Program to capture public-facing notes from the day including broader themes, ideas, and discussion topics. City Bureau strives to “bring journalists and communities together in a collaborative spirit to produce responsible media coverage and encourage civic participation.” Our Documenter, Corli, took the notes below:

I was personally inspired by this work, excited to see how future Community Technology Forums in other neighborhoods will be similar or different. The more I have the privilege of co-organizing and attending sessions like the Community Technology Forum and the Array of Things Civic Engagement Events, the more I realize the value residents can bring to public technology planning processes. Technology and technology resources — whether they are public computer centers, wireless networks, or environmental sensors — can be deployed for residents and with residents’ input.

Read more about Community Technology Forums here.

To get regular digital inclusion updates, events, and news delivered to your inbox, fill out this form: bit.ly/joinconnectchi.

Announcing the April Connect Chicago Meetup: Digital Inclusion Asset Mapping

At the next Connect Chicago Meetup we will break into working groups to co-build a better shared inventory of public digital inclusion resources and assets. Unlike other Meetups, there will be no featured speaker. Instead, the focus will be on networking, problem solving, and group collaboration, much like what’s been done in our Connect Chicago working groups

Event: Digital Inclusion Asset Mapping

Where: The Chicago Community Trust

When: Friday, April 28th from 11am to 1pm

RSVP at this link.

Connent Chicago members are invited to join one of three breakout working groups to map out:

  • WiFi & public computing resources — This group will strategize ways to improve + expand + evangelize information about free place-based resources for digital inclusion. Here is an existing inventory to build on. 
  • Local Digital Inclusion Programs — This group will brainstorm all of the great work they know of in our network. They can strategize which types of partners should get more involved in local digital inclusion work & partnerships. One potential starting place can be this existing inventory.
  • Training Resources — This group will compile free online curriculum and digital learning platforms to be shared widely with Chicago’s digital inclusion community. They can build on and identify gaps in this existing collection.

Come join the conversation and co-build digital inclusion content to help fuel an equitable tech ecosystem in Chicago. Meet and network with computer trainers, nonprofit professionals, technologists, community advocates, and fellow residents who care about digital inclusion in Chicago. Please RSVP so we can get an accurate count for lunch. Thank you!

The Connect Chicago Meetup is a monthly gathering of computer trainers, nonprofit professionals, and fellow residents who care about the digital lives of Chicagoans. In 2017, Meetups will be held downtown and some events (called Community Technology Forums) will be held at community learning & nonprofit sites across the city. Email me with any questions, concerns or ideas for future Connect Chicago Meetups: [email protected]

Health Insecurities: Does Data Show Improvement?

Is There A Backwards Slide?

In a June 2016 GALLUP article  by Jeffrey M. Jones and Nader Nekvasil it was reported that U.S. Healthcare Insecurity was at a  record low as “fewer Americans reported not having enough money to pay for necessary healthcare and/or medicine.”

These findings are based on interviews conducted daily from January 2008 through March 2016 as part of the Gallup-Healthways Well-Being Index. Gallup and Healthways classify Americans as healthcare insecure if they report being unable to pay for healthcare and/or medicines they or their family needed at some point in the past 12 months.

Overall, the percentage of U.S. adults with healthcare insecurity has dropped 3.5 percentage points since the fourth quarter of 2013. This drop in healthcare insecurity coincides with the decline in the percentage of uninsured Americans, which has fallen from 17.1% in the fourth quarter of 2013 — just before the Affordable Care Act’s requirement that Americans have health insurance went into effect — to 11.0% in the first quarter of this year.

The increase in the percentage of Americans having health insurance is likely a key reason why fewer Americans are struggling to pay for healthcare. Generally, those without health insurance are at least three times more likely to report not having enough money for healthcare/medicine than their counterparts with health insurance. In the most recent quarter, 41.8% of the uninsured said they had struggled to pay for healthcare costs, compared with 12.3% of those with insurance.

As a certified ACA In-Person Counselor it is quite frightening to consider the cost in lives that an ill-advised, ill-conceived repeal of the Affordable Care Act will cost. This gives me great pause and concern about how the most vulnerable populations will survive.  I worked with hundreds of families between 2014-2015 in Illinois who were able to gain and afford coverage under the provisions of the ACA. Families that otherwise who would have not received emergency and necessary care, including surgeries that saved lives. These changes will not only affect the Black and Brown communities, they will impact all impoverished communities. The buzz words being offered are “everyone will access to healthcare” well you can have “access” to a multitude of services in a free country. However, if you can’t afford them is it really accessible.

As reported in CRAINS Chicago Business, in Illinois, more than 1 million people gained insurance under the ACA, and, of those, 650,000 qualified under a Medicaid expansion that House Republicans appear keen to let bleed. Estimates from the Congressional Budget Office project that the ranks of the uninsured would double by 2026, which would mean a step back into the time warp of too many people delaying treatment and then landing in emergency rooms after their problems are critical. For taxpayers, it’s much cheaper to keep tabs on a diabetic than it is to pay for kidney dialysis or limb amputations—two very real outcomes when the disease goes untreated.

What Do We Stand To Lose?

While Medicaid expansion, minimal essential coverage, zero lifetime maximums and free preventative services are on the table to be repealed, another provision of the ACA is the requirement for hospitals to conduct “community health needs assessments” to justify the tax exemptions they receive for providing “charity care”. These community health needs assessments uncovered and confirmed what may sociologists and human service professionals already new. There are other social determinants to health. Health is holistic and includes more than a patient’s medical history. These social determinants include but are not limited to:

  • Access to healthy food (Food Deserts)
  • Susceptibility to violence (Domestic and Community)
  • Housing Insecurities
  • Unemployment
  • Access to transportation
  • Behavioral Health

Many hospitals as a result of the CHNAs developed or grew programs to address these problems in their communities. “These plans will improve population health, reduce costs and result in better quality care. Furthermore, these plans provide new opportunities for hospitals to invest in upstream interventions– working to make policy, systems and environment improvements that will impact the communities in which they serve.”-Bechara Choucair, M.D, Former Commissioner, Chicago Department of Public Health

“If the ranks of the uninsured or underinsured grow, then charity care will increase. And the ability to do some of these more creative efforts will be hampered.” said -Joan Quinlan VP for Community Health Massachusetts General

Tools We Can Use

The Chicago Department of Public Health will be deploying an updated version of the Chicago Health Atlas which will include the findings, strategies and implementation plan from Healthy Chicago 2.0.  Data from this collaboration is being used to identify and address 10 priority areas to focus community health improvement efforts on over the next 4 years. These priority areas include both health outcomes and social determinants of health, as well as public health infrastructure elements like partnerships and data.

The Chicago Health Atlas is a resident facing Web site for displaying aggregate health-related information on a map so that people can see the prevalence of specific health conditions in their area and find out how they can improve their health and get  information about health care provider options in their communities.

What Now: After The Vote?

So, what now? What next? This is a small victory, a reprieve if you will. This will undoubtedly rear it’s head again before this Presidency ends. We must continue to “Listen.”  Listen to the stories of the residents and Americans whose lives and health was positively impacted by their ability to obtain health care either through the Marketplace or through expanded Medicaid coverage. We listen to the lawmakers from our state and follow their comments and votes on the measure which will change the lives of many Chicagoans. We listen to seek to understand  the elements that do need to be changed; and change them for the good. This is not a partisan issue. Everyone in Illinois who is concerned about the well-being of our fellow citizens should be concerned about the impact of this process on our city and our state.