Note: this is the first Smart Chicago blog post by Andrew Seeder. Andrew has worked for the Chicago Community Trust on data projects for CEO and President Terry Mazany, and has been doing lots of thinking and writing from the Chicago School of Data project. Here’s his presentation of what we think can be a helpful classification system for seeing and understanding our regional data ecosystem. He will be at our conference this Friday and Saturday— please talk with him about what you think! — DXO
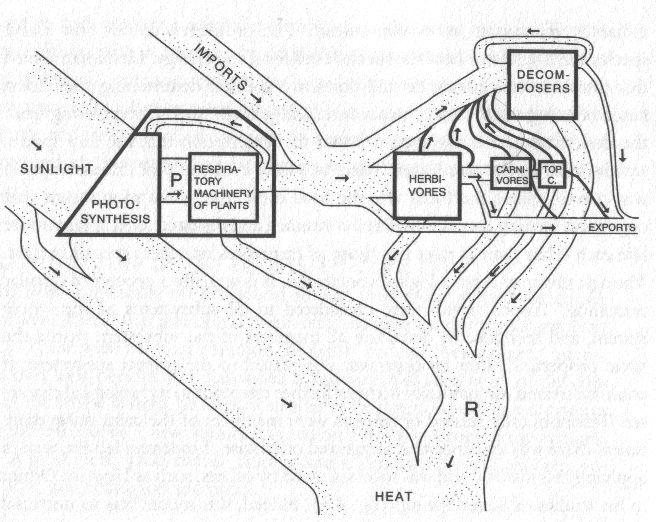
After months of interviews and hundreds of surveys we’re beginning to see how the regional data ecosystem fits together. The ecosystem grows and develops because we create data for others to use, we consume data made by others, and we enable each other to do the same. We found data creators, data consumers, and data enablers.
Some organizations create packaged data sets of data they’ve collected, while other organizations make it a business of cleaning free, public data. Others donate hardware and their expertise to local schools or, as an institution, they fund organizations working in the field. But data creators consume data and data consumers enable others to create data. These broad categories aren’t mutually exclusive.
Among data creators, some organizations provide their data for free, at no charge to either the public or other organizations. These “open” organizations include a lot of large (especially public) institutions, like the City of Chicago or the U.S. Census Bureau. They have the resources and capacity to develop full toolchain platforms. They are one-stop shops for pre-packaged data, also known as data that can be uploaded into and illustrated by common workplace software. There are far more organizations that offer data for a fee, or only under special circumstances.
Data!
We found that there were many organizations with the desire to contribute to the ecosystem, but lack the technical capacity, funding, or have pre-existing legal agreements that stop them. Here’s a structure for classifying data creators in a data ecosystem. We are working to place all the participating organizations from the Chicago School of Data project into this structure. Check to the right of each line of (JSON) code to see a simple English explanation of what each line means, separated by arrows (“–>” and “<–“):
Some organizations consumed only free data where others were willing to pay for data. No surprise, most organizations work with free data, especially when it’s well documented and easy to use. Free data comes from all over, but the greatest challenge among data users was getting available data into a format familiar enough to be easily incorporated into their organization’s pre-existing workflows. A platform that makes an organization’s workflow smoother, gives it a greater impact in its field, or helps it fundraise is very valuable. People pay for and get paid by data work. So how does data leave the ecosystem? We want to see which organizations use data to evaluate their own operations and which ones use data to evaluate other organizations’ operations. We mean this broadly. Many organizations use data just for their in-house presentations, annual reports, and miscellaneous memos. Some use data to evaluate the state of an entire sector, such as housing or education, by publishing research reports or data sets. Let’s break it down again:
Many of the organizations we heard from made it clear that they don’t use data just to write memos. Evaluations aren’t the only thing that people can do with data. A smarter data ecosystem means faster buses, greater accountability among our elected officials, and better communication between neighbors. That’s why we need your help coloring the picture of the regional data ecosystem.
People enable the data ecosystem by volunteering their time, their expertise, and by providing physical goods to organizations. We divided volunteers, funded organizations, and for profit organizations by whether they provide goods or whether they provide services to the data ecosystem. For now, we’re including only training, analysis, and a generic “other” category under services, and, under goods, only physical hardware, tangible goods that meet basic needs (like beds and food stuffs), and a generic “other” category. Here’s the code:
At first, we classified partners in the data ecosystem by the different types of organizations out there. The ecosystem includes multinational corporations, tiny local nonprofits with shoestring budgets, philanthropic institutions, public agencies, whole governments, and everything in between. Yes, our region’s data ecosystem is supported largely by data created (and released) by a few large public enterprises. But there were too many similarities between organizations across sectors to continue classifying the ecosystem’s partners by industry alone. We needed to classify organizations relative to the who, what, when, where, and why of data. So, on top of the very basics–creators, consumers, and enablers–we discovered differences that get us closer to defining the ecosystem’s flows.
Help us expand this structure. What other ways do people and their organizations enable the data ecosystem? What else do data consumers create with their data? Who are our data creators and how do we get their data to work?
