As part of our philosophy to be open and transparent, we’ve got a new feature— Show Your Stats. In the civic tech world, we make a lot of stuff and we churn our legs in the right direction, but there’s very little public feedback loop on how we’re doing and whether we’re actually serving humans.
We are going to publish stats for all of our public-facing tools, and wanted to kick it off by showing traffic statistics for the Smart Chicago Collaborative website for 2014. Our site is one of the most visible public outreach tools and the main way we address the civic innovation community.
We get all of our data from Compete.com, Google Analytics, and the internal tools provided by Twitter and WordPress.
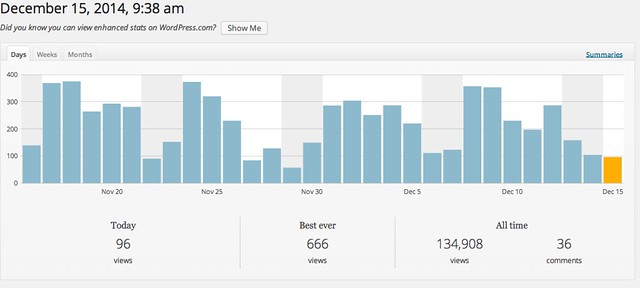
For the year, we’ve had 78,548 pageviews which is an additional 22,160 views from this time last year.
Below the fold, we’ve outlined our stats for the blog and our social media channels.