As part of our philosophy to be open and transparent, we’ve got a new feature— Show Your Stats. In the civic tech world, we make a lot of stuff and we churn our legs in the right direction, but there’s very little public feedback loop on how we’re doing and whether we’re actually serving humans.
We are going to publish stats for all of our public-facing tools, and wanted to kick it off by showing traffic statistics for the Smart Chicago Collaborative website for 2014. Our site is one of the most visible public outreach tools and the main way we address the civic innovation community.
We get all of our data from Compete.com, Google Analytics, and the internal tools provided by Twitter and WordPress.
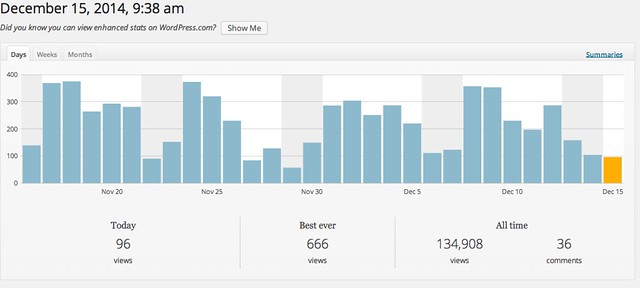
For the year, we’ve had 78,548 pageviews which is an additional 22,160 views from this time last year.
Below the fold, we’ve outlined our stats for the blog and our social media channels.
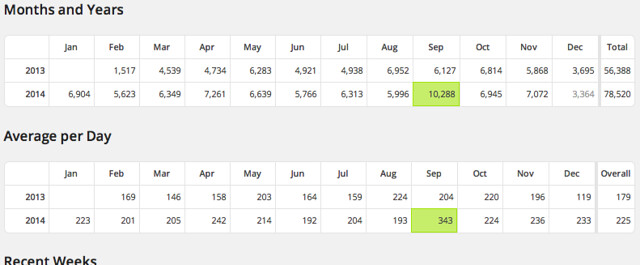
This is a screenshot from our stats page in WordPress. As you can see, our biggest month also falls in line with the Code for America Summit. (October of last year and September of this year.) Because the Chicago School of Data and the Code for America Summit fell within two weeks of each other – our stats for September 2014 was tremendous! 10,288 views!
This is due to the social media work of the indomitable CivicWhitaker, showing that when you are delivering valued content to a sub-community, you can really drive traffic.
Our average pageviews per day also improved from last year. Last year, we had about 179 pageviews per day and now we average about 225. We suspect that during events such as the Chicago School of Data or when we publish topic-specific posts like the Divvy Apps Contest we get more one-off readers.
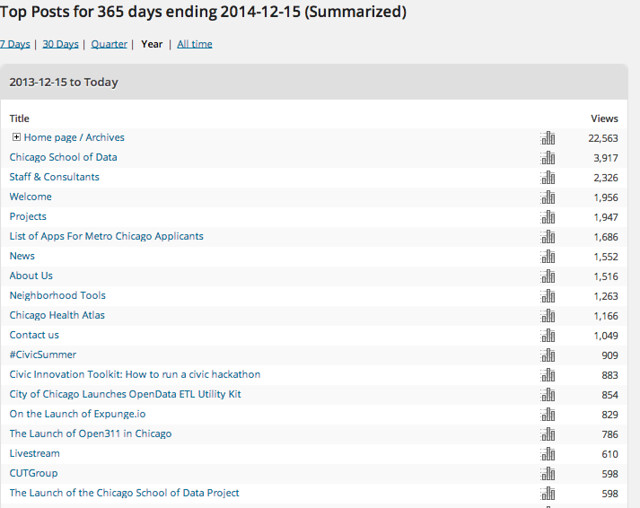
Our top post for the year was our Chicago School of Data project page.
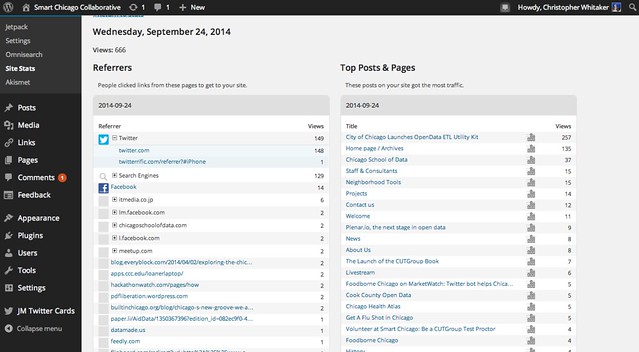
Our biggest single day on the site was September 24th when we published a post about the city’s new ETL toolkit during the Code for America Summit. (Editor’s note: This particular day had us hitting 666 pageviews. This is somewhat disconcerting to us and our 2015 goal is to surpass this to at least 667.)
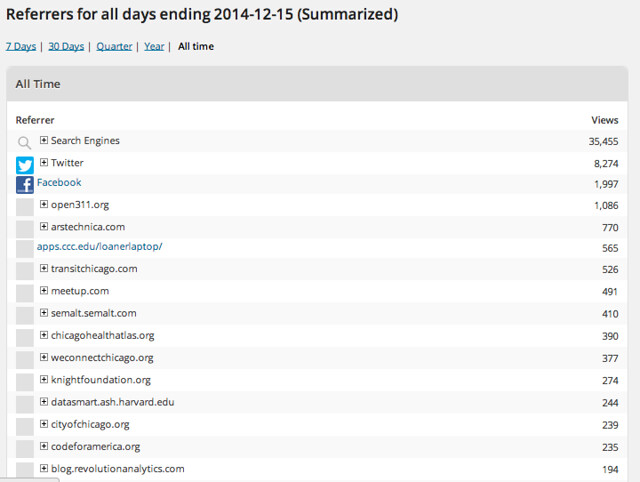
Our top referrer by far was Twitter. Like last year, our engagement on Twitter far surpassed Facebook by a margin of 8 to 1. Granted, we also Tweet much more than we use Facebook. We do purchase advertising on Facebook and it still doesn’t have the same impact as Twitter does. Our third highest referrer is a blog post cross posted on the Open311.org site years ago.
We suspect that some of our traffic spikes on the site are thanks to our live tweeting of major events like the Code for America Summit and the Chicago School of Data Summit. To give you an idea of just how much our engagement on Twitter spikes during these events – here’s our stats.
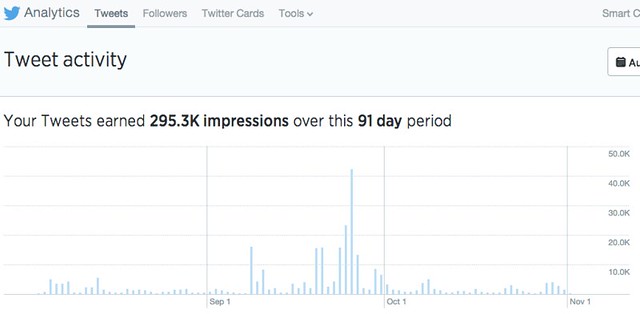
That big spike in the middle is during smack dab in the middle of the Code for America Summit. We had over 80 thousand impressions during those three days along. To give you a comparison, we average about 2,500 impressions per day.
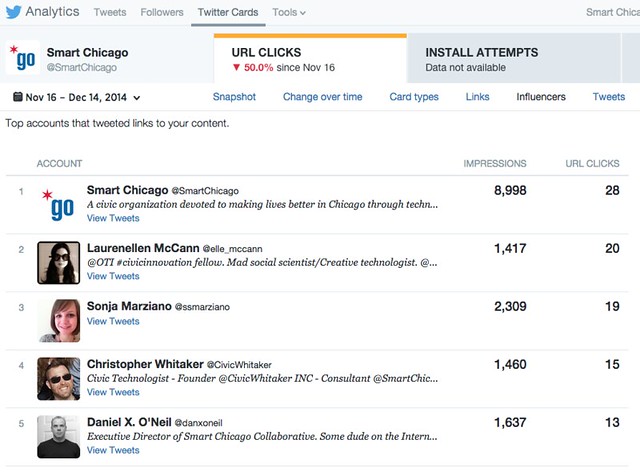
We also started using Twitter Cards, but we aren’t sure if it’s improving our clicks or not. Our biggest Twitter Card engagement so far has been our announcement of a new project we’re launching with Laurenellen McCan. That said, the Twitter cards provide some extra anayltics so we can get a better idea of which Twitter accounts have more influence and which tweets have the most engagement. We’ve provided screenshots of our biggest influencers for the past month below.:
In 2015, we plan to generate even more content – which a specific focus on highlighting aspects of Chicago’s civic innovation ecosystem.
Have thoughts on our blog? Feel free to drop it in the comments below!


