Transit Night at the OpenGov Hack Night


At this week’s OpenGov Hack Night, we had presentations from Ed Zotti and Joe Iacobucci about transit and data in Chicago.

Joe Iacobucci is a Chicago transit enthusiast and gave a presentation on the link between public transit and economic development.

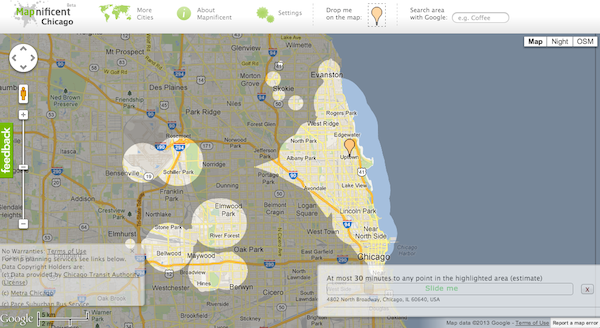
As an example, Iacobucci used a site called Mapnificent to show a locations access to transit by calculating how far a traveller could go by using public transit. Mapnificent uses transit data to calculate all the areas that can be reached by public transit in a given period of time.

For example, a rider that starts in the loop could go as far as Wilmette, Maywood, Homewood, or Calumet City in just 30 minutes. (Even without the Metra, a rider could still reach Evanston, Jefferson Park, or Englewood.) In comparison, a rider who starts in Cicero would only be able to reach as far as Greektown or Melrose Park in 30 minutes.

When you compare this information to real estate prices on sites like Zillow, you can see that the areas with greater transit options tend to have higher home values.

We also had a presentation from Ed Zotti, editor of The Straight Dope and assistant to the legendary Cecil Adams. Zotti ran through a recent history of Chicago Transit in terms of ridership capacity. Zotti has written extensively about transit in Chicago including a Chicago Reader feature on How to fix the El.

Resources for developers interested in transit issues.

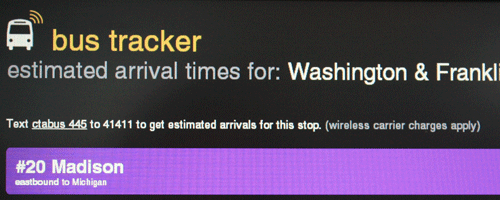
Chicago has 43 sets transit data available to developers on the city’s data portal. This data includes everything from transit routes, bus ridership, to the annual boarding totals all the way from 1988. The CTA also has three APIs for developers to use in their own apps. These include bus tracker, train tracker, and a feed of all customer alerts.


The CTA even has instructions on how to build your own CTA Transit Info Display.

The next OpenGov Chicago Meetup:

The next OpenGov Chicago meetup will be this Thursday at the Chicago Community Trust. We’ve invited three speakers to give thoughtful critiques of the open government movement in Chicago. These speakers include:

  • Ramsin Canon, political editor at GapersBlock.com will provide perspective on the extent to which the movement benefits local communities.

  • Terry Pastika, Executive Director of the Citizen Advocacy Center will give a view of the current state of democracy in Illinois, with a focus on the Western and Far Western suburbs of Chicago.

  • Mike Stringer, Managing Partner at Datascope Analytics and organizer of the Data Science Chicago meetup group, will talk about whether we’re asking the questions most worth answering.

If you aren’t able to attend in person, the meeting will be live streamed on the Smart Chicago Collaborative blog.

Schoolcuts.org: Open Data and Civil Discourse


Last week, Chicago Public Schools announced that it was closing 61 schools due to budget constraints. Even before the list was announced, the plan to shut down schools was and still is generating lots of heated debate.

CPS has released data on each school, but it isn’t always organized in a way that makes it easy for parents to see what is going on at the school. To find out information on the school utilization, you would first visit a separate 19 page PDF file to see how CPS determines utilization. You then have to download an excel file and search through it to find the school you are interested in. This is a particularly thorny problem for parents and community members who care deeply about their schools as community anchors.

Schoolcuts.org Screenshot

What schoolcuts.org does is pull out all the available data on every school that is either being closed or receiving and put it in one place that’s easy for parents and community members to see.

https://soundcloud.com/morningshiftwbez/130322-morning-shift-seg-c

Listen to Schoolcuts.org’s Jeanee Olson talk about the site on WBEZ Morning Shift

Getting the data out there to the community in a format that’s easy to understand is extremely valuable. Not only is it important for parents to know what kind of schools that their children are being sent to, but having the data readily available makes for a better debate about school closings for all those involved.

One of the points of contention is that Chicago Public Schools has stated that children would only be moved to higher performing schools. CPS places schools into three tiers with regards to academic performance with he first tier being the best performing. However, there are several receiving schools that are Tier 3 – meaning they are the worst academically performing schools in the district. Because this data is open, and is being presented in plain language, community members can use this data to advocate for their schools.

Open data can and does aid in civil discourse.

Another point of contention is the role of charter schools and how they affect the neighborhood schools. One sides states that charter schools do a better job of teaching our children, while the other side states that opening additional charter schools robs resources from struggling neighborhood schools.

The Chicago Tribune wrote an editorial supporting charter schools stating that there were 19,000 students on waiting lists for charters schools in Chicago. This number was then disputed by WBEZ.

https://twitter.com/WBEZeducation/status/316361105410764800

WBEZ’s point was that the list of students on waiting lists for charters was generated by combining the waiting list of each school, some of which had students that had applied to multiple charter schools. 

Instead of just rhetoric, we’re now seeing debates in the public domain about the data. And that’s a good thing. This isn’t the only example of this being done. WBEZ’s Day by Datum blog recently provided a detailed explanation of the recent data spat between the Chicago Sun-Times and the CTA over crime data.

Sometimes the best civic apps are not the ones that give us the answers, but the ones that bring up the hard questions – David Eads

As we talk about open data and the ability of civic apps to solve problems and help us answer questions about civic lift, it’s important to realize the potential that open data has to improve civic discourse. Schoolcuts.org has helped to steer the course of the debate back to the data and that’s a powerful thing.

Data Potluck: 7 Million Rows of Data

There were a lot of people at this week’s data potluck

Data Potluck is a monthly event occurring the last Tuesday of every month at 6:00pm inside 1871.  Like the OpenGov Hack nights, these events focus on how open data and civic apps can help improve the citizen experience. However, these events have a more non-profit focus to them. Data Potluck was inspired by last year’s DataKind Data Drive which helped gather data for the Chicago area Red Cross. In order to keep the effort moving forward, Young-Jin Kim, Matt Gee and Nicholas Mader started the DataPotluck Meetup group.

DataPotluck’s other advantage? People bring food.

Rayid Ghani, Chief Scientist for Obama for America

At this month’s Data Potluck we had two presentations. The first was from  Rayid Ghani, former Chief Scientist for the Obama for America 2012 Campaign. Rayid explained how the Obama for America campaign used the power of predictive analysis and social media to help win the election. 

Rayid announced that the same model that made the Obama team so effective at their outreach efforts would be made available to non-profits.

Historical Traffic Congestion Data

The second presentation was by the City of Chicago’s Chief Analytics officer to announce the release of a seven million row dataset. Chicago has just released data on traffic congestion by segment.


To get an idea of just how big this data set is, a traffic segment is about a half mile. The city has 300 miles of road that the city keeps real-time traffic data for. The city refreshes the database that lives on the portal every ten minutes.

The city first released the real-time data in December, but civic developers wanted to take a look at historical data.

So, the city worked with Socrata to enable the city’s data portal to be able to handle such a massive volume of data. Now, civic developers can dig into all of the Chicago’s traffic data.

To help developers dig into the data, they’ve created a very well documented API.

This documentation includes code samples in multiple languages on how to access the data as well as definitions on all the different fields in the data set and the possible errors you could get.

Now that this data has been released, we’re excited to see what cool, useful, and interesting things that people will do with this data.

If you want to work with civic data:

For people who are interested in working with civic data, there are two opportunities that they should look into.

The first is the Chicago Data Science Fellowship. The University of Chicago and Argonne National Laboratory are recruiting people with statistics, programming, and data skills to work with real world data to make an impact on social issues.

The second is that the City of Chicago is hiring a data scientist to help ensure that Chicago becomes the very best civic data team in the world. The City of Chicago is looking to hire a new data scientist to join their team. If you are interested, you should apply on the city’s website.