Matthew Shaxted dropped by Chicago’s OpenGov Hack Night to talk about how data visualizations can be used to create smarter cities.
Shaxted started his talk with the ways that data visualizations can help make cities more effective and efficient.
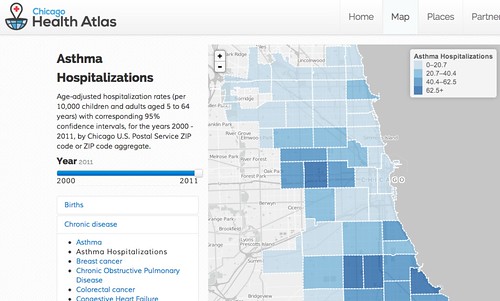
Data visualization is the art and science of taking data and visualizing it to make it easier to understand. The most common way that people see data visualization are maps that show location.
However, there’s only so much data that can be shown on a 2D platform. Using an OpenGL engine, data scientists can display data in a 3D format to give users greater perspective.
One of these programs is called CityMirror, which displays different data sets on a map of Chicago. Shaxted demonstrated this app at the hack night.
It’s not just displaying data that helps cities. Another method is using agent-based simulation to try and predict what happens if you change a particular policy? (For example, if you place a new bus stop here – how will that affect traffic?)
On a bigger scale, the City of Chicago is working with the University of Illinois Chicago’s Electronic Visualization Lab to visualize city data in a virtual reality environment.
If you’re interested in learning more about data visualization, check out the Chicago Data Visualization Meetup group.


