Twitter recently released the ability for anyone to be able to get access to Twitter’s analytics panel. So, we’d like to share ours.
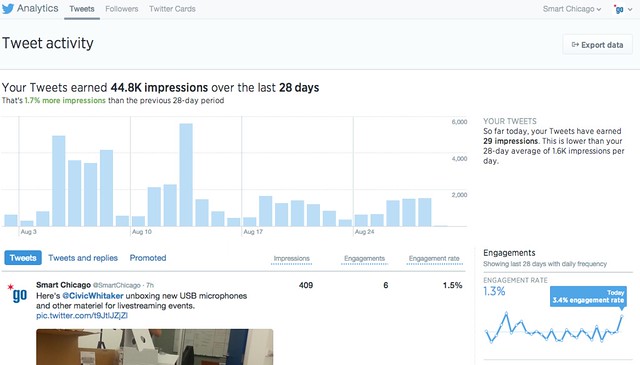
The first thing we’re looking at is our impressions over the last month. Twitter defines impressions as number of times somebody has read one of our tweets. If you notice, August 13th tends to stick way out there in terms of number of impressions. That’s from a tweet made during OpenGov Hack Night in which we were tweeting about the Data Science for Social Good presentation. This particular tweet generated five retweets of accounts with over 1k followers resulting in 3,224 impressions.
Now speaking @rayidghani with @datascifellows! #chihacknight pic.twitter.com/OjmKsOvASp
— Smart Chicago (@SmartChicago) August 12, 2014
Retweets are powerful things.

The other thing that we’ve noticed is our follower count has been doing fairly well. We started the account 7/29/2012 and have gained followers steady ever since. Right now, we’re at 2,395 followers. Interestingly enough, our follower count by location matches our blog with a little less than half our following coming in from Chicago. The other cities that follow us our Philadelphia, Washington DC, New York, and San Francisco. About ten percent of our followers are from overseas. (We suspect a big chunk of that is the United Kingdom which would match our blog traffic.)
However, off all metrics engagement is what we value the most. Specifically, when we tweet out links we’d like people to read them. Twitter is our 2nd highest site referrer with 4,754 referrals so far this year. The number one site traffic generator has been search engines with 19,545 referrals. Facebook comes in at third with 1,088. Our individual tweets hover around a 1-2% engagement rate. (The rate in which people click on a picture, link, or retweet our tweet.) We tend to get a higher rate when we post a picture and an even higher rate when we mention the word ‘hiring.’ People like job listings.
But for our other Twitter Account – @FoodborneChi – engagement becomes much more important. When we tweet at somebody with the Foodborne Chicago account, we want them to click on the link so that they can fill out the form about where they received food poisoning. Here’s our analysis page for that account.
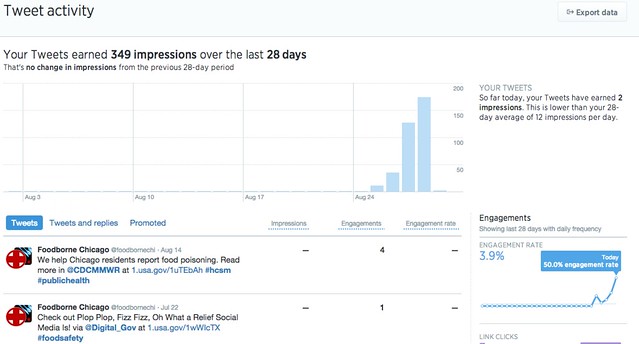
You can see that the number of impressions for Foodborne is much lower, but that’s ok. Most of the time, we’re sending out @replies that can’t be seen by everyone. What we care about is the engagement rate. Here the engagement rate gets kind of deceptive. We don’t tweet from the account everyday, and when we do the account can jump to a 50% engagement rate. When looking at individual tweets, we’re noticed that about 30 people are looking at the @reply tweets we send. We assume it’s because people are checking out the app. For this, we really only care about the original users who 1) click the link to the form and 2) actually fill out the form. So, because people are looking at it’s not the most useful form of analytics. Although, it is interesting. (We do see a lot more people clicking on our user profile – a sign that when we tweet people they ask “Hey, who are these people?”)
One of the other things that we do for the Foodborne Account are Twitter Cards. Twitter Cards are ‘cards’ that get embedded in the tweet when we tweet out certain links. (For us, it’s the main foodborne site.)
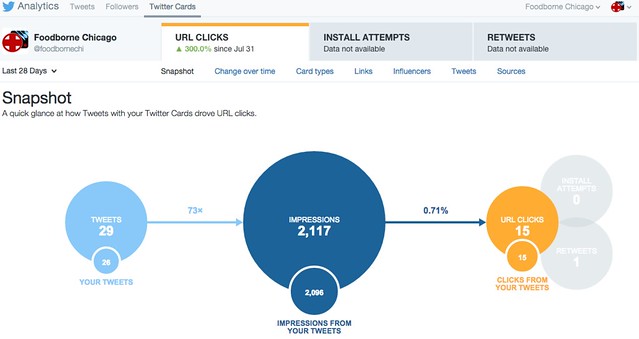
We’re not really sure what impact the Twitter cards have had because the analytics tool only gives us the last 28 days and we started using them in June. We also started using Twitter Cards after our first Civic User Test where we also started mentioning the Chicago Department of Public Health more often. So, it’s hard to tell which action increased our engagement rate.
For comparison purposes, here’s my own Twitter Analytics page:
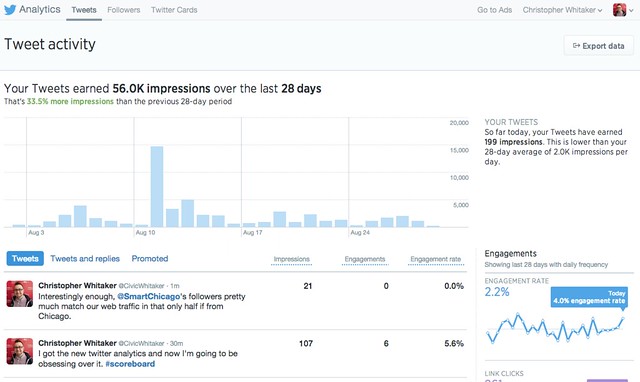
I had slightly more impressions than the Smart Chicago page, owing mostly to this tweet.
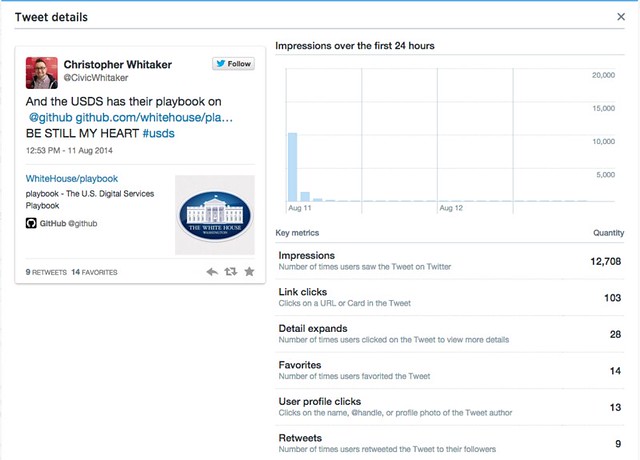
That tweet was retweeted by @ericries who has 181 thousand followers. And that particular tweet was about some very big big news. Content is king.
Now that we have analytics open, we’ll be keeping a closer eye on it and report back on them from time to time.


