For the last hack night of 2013, Christopher Whitaker and Derek Eder will showcase some open gov highlights from the past year. Live Stream starts at 6:15ish.
Our presentation is below the fold:
Continue reading
For the last hack night of 2013, Christopher Whitaker and Derek Eder will showcase some open gov highlights from the past year. Live Stream starts at 6:15ish.
Our presentation is below the fold:
Continue reading
Smart Chicago Collaborative had a very busy 2013 year. Here’s a look back.
At this week’s hack night, Forest Gregg of DataMade gave a talk about Chicago’s hidden open data. While the civic innovation community has gotten used to going to data.cityofchicago.org for their open data needs, there’s a lot more data that’s not on the portal.
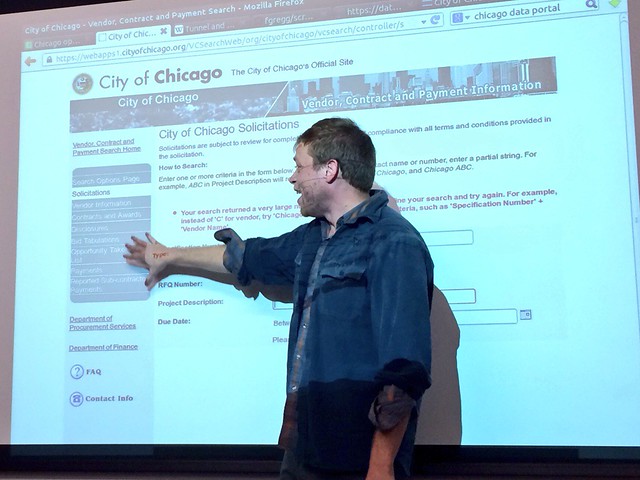
The last few OpenGov Hack Nights have been spent building out a website (opengovhacknight.org) to help gather information on projects, people, and events in Chicago’s robust civic innovation community. Another goal of the project is to list all the resources available to developers (including Smart Chicago’s free web hosting for civic apps and user testing.)
A large part of the page has been documenting all the open data that’s not on the portal. Forest Gregg talks more about that below the fold.
While our local governments continue to do an amazing job of publishing to their open data portals, many datasets still exist solely on obscure websites most of us don’t know about.
Forest Gregg will talk about some of these lesser known, but highly useful, open data sources available in Chicago including river pollution, financial interest statements, schools and more.
This is part of an ongoing hack night exercise to publicly document Chicago’s open data.
The live stream will start at 6:15ish CST
For our fifth Civic User Testing session, we tested ChicagoWorksforYou.com, a Smart Chicago project. This was our first remote CUTGroup test and it took place on November 25, 2013.
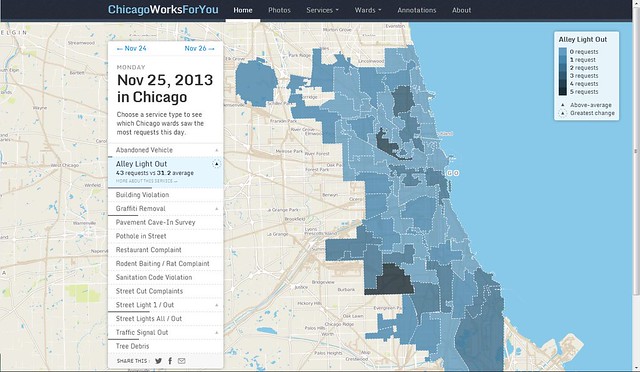
ChicagoWorksforYou provides citywide information about city service requests. Users are able to get a ward-by-ward view of service delivery in Chicago, learn about the top service requests made on a given day, view photos of requests, and learn more about the process of submitting service requests.
This Web site uses data directly from the City of Chicago’s Open311 API, and shows the days with the most service requests going back to January 1, 2008.
Through this test, we wanted to find answers to these key questions:
On November 23, 2013, we sent out an e-mail to all 565 CUTGroup participants asking them if they would be available to provide feedback through a remote test. We asked some screening questions to gather extra information, but the responses did not influence their participation.
We received 116 responses in one day and asked 90 random respondents to do the test. In addition, we asked 5 willing testers to do a test via screen share. We randomly chose our respondents, and compiled a group of testers from all areas of Chicago, and had a variety of responses to our questions.
Why 95 testers?
We ask participants to visit the Web site for 20 uninterrupted minutes on one day (November 25, 2013) and answer questions about the Web site through an online form. We asked “yes” or “no” questions to gather quantitative results, open-ended questions to see what users were interested in when visiting the site, and finally asked users to click on specific links of the Web site, and discuss their experience.
We wanted to conduct a screen share 5 people through Google Hangouts to monitor their actions, but due to technical problems, we were unable to do the screen share. In the future, we would like to provide more technical instructions on how to screen share and give extra time.
Since this was our first remote test, we were interested in seeing how many people would be interested in doing this type of test, and see how thorough and clear the responses were without a proctor. We were pleasantly surprised at the thoroughness of tester’s responses without a proctor being present.
We still value in-person tests, and believe they are an opportunity to convene participants from all areas of Chicago. We gain valuable responses in person and are able to record a tester’s actions and reactions.
Here are a couple of responses we heard from our testers specifically about the remote test:
“An online test is a better form of testing a website or app. It is done within the comfort of one’s home, with flexible times. It allows more people to participate and allows for a more natural environment.” –Tester #77, Elizabeth07
“I do like the remote survey better than the one I had to go to the library for. The particular public library I had to go to was in a very dangerous area and I didn’t know before I went…Other than that it has been a pretty good experience being a part of the CUTGroup thus far and I’m definitely willing to give my input on multiple websites.” – Tester #46, 3rd Year Student
At the end of the day, 84 users tested the Web site and gave us feedback. We learned that most testers were interested in learning about service requests in their own ward, and see how their Alderman is doing. When visiting their ward’s page, testers responded positively to having their Alderman’s contact information in one place. 82% of testers said they would use this Web site again.
How do users use the site? What do they have difficulties with?
Are users interested in the Web site’s content (city services)?
A lot of testers are interested in the Photos page. However, only 1 person clicked on “Photos” first when they visited the site. When directed to the “Photos” link, 89% of people said “Yes” they liked the “Photos” page. Below is a screenshot of the “Photos” page.
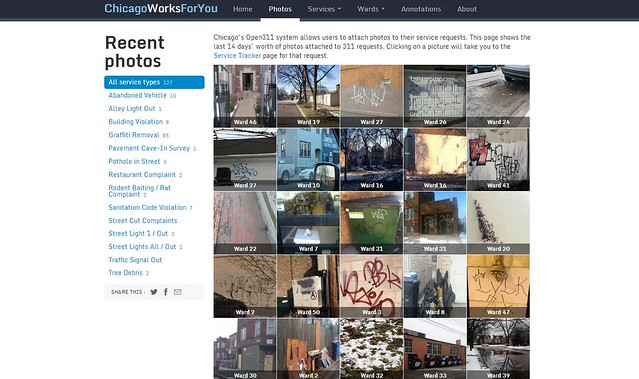
Here are some steps to make the “Photos” page more prominent:
Do users want to share information from the Web site through social media/e-mail?
Will regular Chicago residents find this Web site interesting?
“I like the website, but I don’t know if I’ll use it again. I’ve never reported any of these things before. That being said, I never knew how to or really thought about it. I might be more likely to know that I know this exists. Especially because I could actually see if my request was followed up on and taken care of. That would be worth the effort. I do wish there was a submit request button more prominently located. though. Those are kind of buried and I didn’t initially realize I could do that.” – Tester #63, Aspiring Batgirl
“I like the website, but it doesn’t have much of a purpose for me, unfortunately. It’s collecting and displaying data, but as a resident, I am most interested in submitting issues or seeing if an issue has already been submitted.” – Tester#56, Ketchup Ketchup
Here is a final report of the results with the key highlights from our CUTGroup test, followed by each tester’s responses, and copies of our e-mail campaigns and the questions we asked:
The raw test data can be found below with the complete answers from every tester.
The City of Chicago technology fellowships for this summer are now posted. Take a look!