Private Data and Public Health: How Chicago Health Atlas Protects Identities

Public health information is anonymous. In the day of the data breach, identity theft and wearable health trackers, data scientists have procedures in place to keep it that way.

“Health information presents a huge risk,” says security researcher Larry Ponemon. In a report for the Medical Identity Fraud Alliance, he estimates that 2.3 million Americans have been victims of medical identity theft.

The biggest danger to consumers comes from others using their insurance or other identification to run up medical bills. “You want to take whatever steps you can to protect yourself,” Ponemon says. “In the hands of a criminal, that could be really valuable.”

Data provided to researchers, such as the statistics in the Chicago Health Atlas, are stripped of private data beforehand. What’s left is information designed to compare groups, not individuals.

The goal in data handling is to make sure identities can’t be guessed.

“There is a difference between privacy and security issues,” says Brad Malin, vice chair of biomedical informatics at Vanderbilt University School of Medicine in Nashville. Malin advised on safe handling of atlas data.

“The power of opening up the data is giving people some quick intuition about issues that deserve study,” Malin says. “You can take diabetes and look for a correlation where there are food deserts.”

Chicago Health Atlas

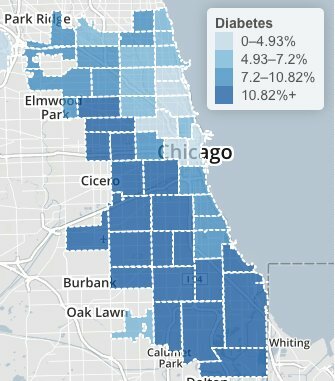
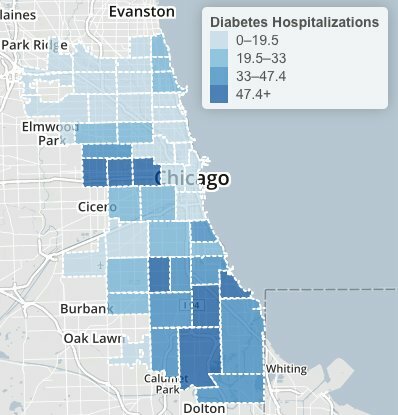
Chicago Health Atlas: Adult diabetes rates, 2006 through 2012.

The Chicago Health Atlas maps shows high diabetes levels across a large swath of Chicago’s South and West sides. Hospital records suggest the highest prevalence in North Lawndale’s 60623 ZIP code, with the most hospitalizations. An animation shows hospitalizations year by year, with the highest recent rate in Calumet Heights’ 60619 area.

Before giving statistics to outsiders, hospitals remove names and other identifiers, such as birthdays or treatment dates. “You may see residents of one neighborhood with an increased chance of having that diagnosis,” Malin says, “but this system will not allow you to drill down on any factors. There’s no individual-level data.

Health workers also withhold unique cases, where a patient might be identified from a combination of sources and guesswork. “We did not investigate rare disorders in the Health Atlas,” Malin says. “You never disclose information on less than five people.”

This can be a sticky issue for agencies that tackle public health emergencies. In a privacy panel at last fall’s Chicago School of Data conference, City of Chicago informatics project manager Matthew Roberts noted that information like date, sex, county and age might be enough to reveal the identity of a West Nile virus victim.

“If you take a look at the obituaries in a small county,” Roberts said, “for any of those given days where the date of death was mentioned, you could pretty quickly figure out who was the 84-year-old male who had died from disease x.”

Federal guidelines recommend making some data more general to protect privacy. In a case like a West Nile virus death, health workers will giving an age range, or a wider area such as northern Illinois.

Data mining also figures into how much information is released. Health workers consider whether identities can be pieced together from multiple sources. That’s a real danger in data breaches: Hackers mine social media profiles to work up enough information to make a false credit application or tax refund filing.

To study medical outcomes by neighborhood, several years of data might be combined to cut the chances that individuals might be re-identified.

“It’s safety in numbers,” Malin says. “You put your faith in that a certain number of individuals are enough to protect the anonymity of everyone in the group. As you get more specific, the risks go up.“

Still, there are dangers to being profiled as a group. Chicago community activists fought for years against insurers identifying whole neighborhoods as bad risks. Battles against home insurance redlining ultimately were resolved in court.

Health care reform bans insures from denying coverage for pre-existing conditions. However, the Affordable Care still allows higher rates by location. The rules require broad areas, no smaller than an entire county. But higher costs still may keep some insurers out of urban areas.

“What are the risks? It’s not quite clear,” Malin says. “In this situation the dangers are group-based. The regulations are defined with respect to individuals. “

Citizens give up bits of their privacy every day to stores or websites tracking their habits, with few complaints if it keeps prices low. But we treat medical care as a public good. We accept that some small piece of our health interactions are for the greater good, whether it’s teaching interns on hospital rounds or stopping infectious disease outbreaks. Our medical care is confidential, but not exactly secret.

“For 150 years, there’s been the expectation that medical information will be used for the public benefit,” Malin says. “In any teaching hospital, or any for-profit hospital for that matter, the information can be reused, unless you decide to be an anonymous patron who pays out of pocket.

“At the end of the day it’s a risk-utility tradeoff,” Malin says. “Unless somebody is actually harmed, they’re not going to see this as a risky situation. These are questions on the table as we move into a data-based society.”

Parks Take Active Health Role at Obesity Conference

LaSalle II school

Children play at LaSalle II school, 1148 W. Honore.

Health workers treating obesity in children are looking beyond what they see in clinics, to what’s at play in Chicago parks.

“Can you imagine camping in Chicago within 15 minutes of downtown?” said Zhanna Yemakov, Chicago Park District conservation manager. At the quarterly meeting of the Consortium to Lower Obesity in Chicago Children, Yemakov outlined park plans for the roughly 1,000 acres of Southeast Side brownfields now among park holdings.

Other speakers addressed the city’s playgrounds, plazas and pocket parks. “Our focus is what we call a socio-ecological approach, where we look at all the factors that influence childhood obesity at all levels,” said Adam Becker, CLOCC executive director, after the June 9 conference. The focus extends beyond individual cases to family, community and the broader social and political environment.

Chicago Health Atlas

Chicago Health Atlas: Diabetes hospitalization per 10,000 residents, 2011

A 2013 city study finds Chicago Public Schools students have above-average obesity rates – 48.6 percent of sixth-graders were overweight or obese. In 8 of the city’s 77 community areas, fewer than one-third of students fell outside the healthy range; in 15 communities, it was about half.

Overweight and obesity do carry long-term risks, according to the Centers for Disease Control and Prevention. In children and adolescents, they include cardiovascular disease and elevated blood sugar levels that can lead to diabetes within a decade.

Obese children also are more likely to become obese adults, with higher rates of heart disease, type 2 diabetes, stroke, cancers and osteoarthritis. The Chicago Health Atlas charts variations by neighborhood in several such adult conditions, including diabetes, high blood pressure, and breast and colorectal cancers.

“If you’re focusing on one you’re not going to solve the problem,” Becker said. “We try to measure impact as best as we can, but with obesity it’s just so complicated. You can’t just say A equals B. The lines are very indirect.”

Continue reading

Doctors Prescribe Data Sharing for Health Apps

Dr. Khan Siddiqui and Dr. Neelum Aggarwal

Dr. Khan Siddiqui and Dr. Neelum Aggarwal field questions after a presentation at Matter in the Merchandise Mart.

Wearable tech developers are taking the pulse of medical professionals – a reading on how useful fitness monitors will be in a clinical setting. Doctors say the biggest hurdle may be getting patients to try the gadgets and check in regularly.

“Especially in our underserved communities, a lot of the devices we’re hearing about, they’re not using them – they’re asking their kids to do it,” said Dr. Neelum Aggarwal, an Alzheimer’s researcher at Rush University Medical Center.

Elderly patients prefer to get medication reminders on flip phones., says Dr. Aggarwal, who has been taking home measurements of memory and physical functions in Chicago since 1996.

“A lot of older peoples are going to the library for Internet, they’re going to the Department of Aging – it’s not in their homes,” she told a group of mobile health developers June 10 at the Matter healthcare incubator in the Merchandise Mart. “What can people do reliably, what can people do easily, and how are you transporting that data back?”

The neurologist had similar issues in India, working with Naperville-based nonprofit Arogya World on a large-scale diabetes prevention effort. Nokia delivered text reminders to cellphone customers 3 times a week. The messages ask if they’ve been walking, taking medication and otherwise taking better care of themselves.

“In India we’re seeing the thin diabetic, people who aren’t eating as much but are at risk because of metabolic syndrome,” Aggarwal said, citing the common conditions that lead to diabetes and cardiovascular disease. “This is a program based on the simple basic question, did you do this?”

Continue reading

Poor Neighborhoods See Kidney Disease Rise in Loyola Study

Dr. Holly Kramer

Dr. Holly Kramer, associate professor, Loyola University Chicago

The risk of kidney disease has been growing in poor neighborhoods, according to research at Loyola University Chicago.

More than a third of new U.S. dialysis patients between 2005 and 2010 lived in ZIP codes where 20 percent or more residents live below the poverty level, compared to 27 percent from 1995 to 2004. Based on patients in the United States Renal Data System, the study is believed to be the first tracking poverty and dialysis cases over time.

The high rates mirror Chicago Department of Public Health figures for 2006 to 2010. As charted in the Chicago Health Atlas, 10 of the 11 community areas with the highest death rate from kidney disease had one-quarter or more households that fit the federal definition of poverty. Poor neighborhoods also see conditions that are risk factors for kidney failure, from diabetes and obesity to high blood pressure and heart failure.

In this edited transcript, Smart Chicago discusses the findings with corresponding author Dr. Holly Kramer, an associate professor in nephrology and public health sciences at Loyola’s Stritch School of Medicine.

In 1.25 million cases, the rate of kidney disease grew overall, and grew more in low-income ZIP codes. What’s at work with these changes?

We linked information from the United States Renal Data System with the U.S Census. We grouped people who initiated dialysis from 1995 to 2004 with the 2000 Census, and then used the ZIP codes that they report. We used the census data to determine how many of those people in those ZIP codes lived below the federal poverty line.

And then we just looked at the association between poverty status and dialysis initiation, using all the ZIP codes where people had end-stage renal disease. The association between poverty and end-stage renal disease incidents was a little big stronger during the latter period, by about 3 percent.

That could certainly be just a random finding, but I think it’s plausible because our measurement of poverty status, the federal poverty line, hasn’t really changed over the past 50 years. Yet the need for making it in society, making sure you have access to nutritional foods, having access to health care, being able to afford your medications, that has dramatically changed.

So you didn’t have information on income of each patient. Would that have been a better predictor of kidney disease risk?

Probably. There are studies that show that individual measures of poverty, if someone just self-reports their income, is going to be a more sensitive indicator of poverty status.

But certainly areas of poverty have no grocery stores, no access to fresh fruits and vegetables. I work in Maywood, and maybe there’s one grocery store in one remote part – there’s no subway system, it’s very difficult for people to exercise, there are no gyms. So if you live in a poverty area it’s going to affect your health.

Those proportions, from 27 percent to 34 percent, either way those are striking rates. Why are so many dialysis patients poor?

If you’re poor your diet is going to be different. Your day to day lifestyle will be different, your access to health care may be different. If you do develop diseases you may not have the disease detected until much later because you’re much less likely to get routine treatment of blood pressure and diabetes. Sometimes it might be too late. You might have substantial organ damage from undetected diabetes.

The same thing is with hypertension: If you’re eating a lot of processed foods, sodium is going to accelerate blood pressure. High blood pressure is a really high risk factor for kidney disease. It’s really problematic. I see kids walking down the street with a 16-ounce Coke and a bag of Doritos at 8 in the morning, and their blood pressure is going to be higher than kids who eat healthy breakfasts. For all their other meals as well, more processed foods means a lifetime of exposure.

Would you have predicted improvements over time, because health care has advanced?

If you look at overall dialysis incidence, you are seeing plateaus and even a small decrease. That reflects better, aggressive blood pressure and diabetes control, and maybe even some screening.

But any kind of chronic disease takes decades to develop. We’re probably not going to see much change for several years. Hopefully the Affordable Care Act makes health care more accessible., and more emphasis on public health will have impact as well.

You mentioned toxins in the study as well.

It’s well known that lead toxicity can affect your kidneys, and chronic lead toxicity is associated with gout, hypertension and chronic kidney disease. That’s the triad. Chicago once had one of the highest levels of acute lead poisoning among children. A lot of people have been trying really hard to eliminate lead exposure. Loyola University Chicago was one of the big proponents.

What are the challenges in low-income areas in managing kidney disease? Are there clinical responses to underserved areas this study would indicate?

It’d be really great to make access to healthy foods more accessible to people who live in poor neighborhoods. That should be a basic right. If people live in a neighborhood that doesn’t have grocery stores they can walk to, they get their food from the gas station and eat carryout. This is really driving chronic disease incidence and making it really difficult to manage chronic diseases. How are they supposed to be eating less salt if everything they’re eating is processed?

The second thing would be more local access to clinicians, more neighborhood clinics. A lot of people are travelling really far, waiting a long period of time, paying parking fees and car payments. It shouldn’t be so arduous.

Kidney disease

Chicago Health Atlas: Kidney disease deaths, 2006-2010

This is a study of U.S. patients. Can the findings be extended to Chicago? What are the lessons for Chicago health workers?

Chicago does have very high rates of death from kidney disease. If there were more health infrastructure, definitely we could be an excellent model for reducing chronic diseases.

The National Kidney Foundation of Illinois has a van that they drive around to different areas. Nurses and physicians and other health care workers volunteer. They screen for blood pressure and diabetes, and they give counseling and help people find physicians if they’re having insurance issues. That’s a great example of an advocacy group trying to do something to help people with chronic diseases. The American Kidney Fund has also done pre-screenings for kidney disease, diabetes and hypertension.

Hispanic patients grew from 11.5 percent of the cases in the early period to 13.9 percent later.

Hispanic adults have about 100 percent higher risk for end-stage renal disease. Some of that could be access to care. The Affordable Care Act does give access to insurance for people who are legal in the United States, but not to the undocumented.

You say in the study that “poverty itself is not static” – it has increased over time. Is the rate the same in the patient and general populations?

The change in poverty status in the total U.S. population is not that big; the change in the dialysis population exceeds that.

The time is framed in two periods, 1995 through 2004 and 2005 through 2010. Why were these periods chosen?

We wanted to make sure each group was within five years of the census. The later period includes years before the recession, but some of the drive in rates during the second part could be because the recession in 2008 changed a lot of people’s poverty status.

Would a year-over-year study show the same trend?

We’re hoping someone will take an interest in what we do, and use more refined measurements of poverty status. But we have to stop thinking of poverty as yes-or-no. It’s a very dynamic thing. Ten years ago you didn’t have to have a computer or cellphone to be an integral part of society.

You tracked patient age as well. The patient population was getting a little older.

The highest incidence of dialysis treatment is among people over age 75 now. As you age you lose kidney function, lung function, memory fades. Sometimes kidney disease is due to the success of people not dying from stroke and heart attack. We’re better at controlling their lipids and their diabetes, so they live longer.

It’s a confluence of factors – hypertension, obesity, high cholesterol – that leads to so much serious illness.

Poverty seems to impact end-state renal disease more than any other chronic disease. It’s such a shame because Medicare pays for all dialysis. It’s extremely expensive. If we did more to prevent kidney disease we could spend a lot less. Big dialysis companies are making a lot of money off of our poor public health infrastructure to prevent kidney disease.

New Cook County Data: Rivers, Streams, and Lakes

Two new Cook County GIS Open Datasets provide information on the bodies of water in Cook County:

  • Lakes and Rivers shows the location and shape of flowing water features greater than five feet in width and major standing water bodies as polygon data
  • Rivers and Streams represents, as a single line, the interpreted midline of flowing water features. Both of these datasets are developed from aerial photography. These are spatial datasets and can be exported as Shapefile or KML

Sourcing Instructors for Youth-Led Tech

We’re in the second week of delivering on our inaugural Youth-Led Tech, and one of the most rewarding parts of running this program is working with our instructors. We assembled a stellar group of people in a very short amount of time.

At Smart Chicago, one of our principles is open. To us, that means publishing open source code, but it also means publishing step-by-step instructions on how we do less technical but often more sophisticated tasks like hiring a high-quality, diverse workforce for tech instruction in a short amount of time.

Here’s how we did it:

We opened the application process on May 15, 2015 and closed it on June 4, 2015 at 8AM. The main instrument was through text on the project page. We promoted the positions via Twitter, email, Facebook, and other means.

On May 26, 2015, we had 36 applications, 3 of which were duplicates. We sent out this Mailchimp email to all 36 applicants, inviting them for interviews

We conducted 15 interviews on June 2, 2015 based on responses to this campaign. As three of us did the interviews— Kyla, Sonja, and I— we collected quantitative and qualitative information in another Wufoo form. We asked general, open-ended questions about why they were interested in the opportunity, and also checked their availability for the six-week course. We also gave each a rating in three areas: classroom management, tech knowledge, and teaching experience.

An additional nine people applied after this initial interview set. We arranged and conducted another 12 interviews with a number of these applicants, as well as people from the initial 36 who couldn’t make it on June 2. We communicated with these people by email rather than Mailchimp. We offered interviews to every applicant, and we interviewed everybody who responded to our offers.

We received 45 applications total. After background checks, consent forms, and consultant contracts, we hired this set of wonder-people:

Youth-Led Tech Staff