This week’s OpenGovHack Night was all about bike share data as Divvy released the trip data and launched the Divvy Data Challenge.
About Divvy
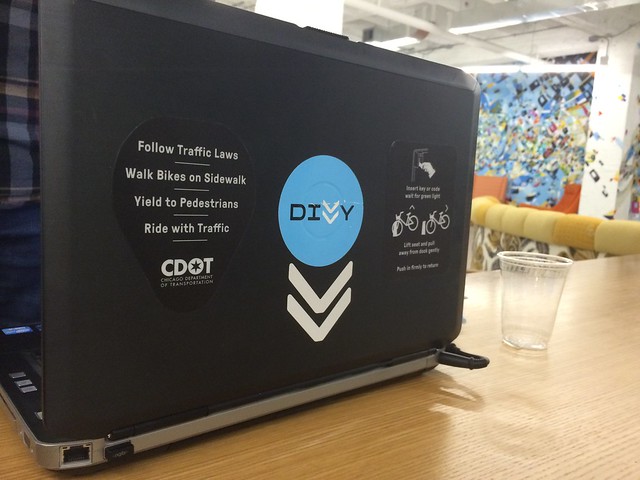
Divvy is Chicago’s bike sharing service run in partnership between Alta Bikes and the City of Chicago Department of Transportation.
DivvyData
Initially, the only data available to users was a JSON feed showing the locations of Divvy Station and the number of bikes available at each station as well as suggestion data for new stations. Divvy has been using the Shareabouts platform to help determine where users want the new stations.
Here’s Elliot Greenberger from Divvy and Gabriel Gaster from the City of Chicago talking about the Divvy system.
The new Divvy Data file includes all the anonymized trip data for 2013 and includes:
- Trip start day and time
- Trip end day and time
- Trip start station
- Trip end station
- Rider type (Member or 24-Hour Pass User)
- If a Member trip, it will also include Member’s gender and year of birth
You can download the data directly from the Divvy website or by clicking here.
About the Divvy Data Challenge:
On the Divvy Data Challenge website, Divvy describes the contest this way:
Help us illustrate the answers to questions such as: Where are riders going? When are they going there? How far do they ride? What are top stations? What interesting usage patterns emerge? What can the data reveal about how Chicago gets around on Divvy?
We’re interested in infographics, maps, images, animations, or websites that can help answer questions and reveal patterns in Divvy usage. We’re looking for entries to tell us something new about these trips and show us what they look like.
The Challenge is open to anyone, and submissions are due by March 11 at 11:59pm.
Here’s Elliot Greenberger from Divvy and talking about the challenge.
Boston has already had one such challenge – the Hubway Data Visualization Challenge – that resulted in 67 visualizations of bike share data.
Bike Share Data Apps
In Chicago, there’s already been a lot of civic app development done around bike share data. During the hack night, three apps were presented.
Viddy
Viddy is a web app built by David Altenburg that helps to keep track of new stations and keeps averages on the actitivy of each station. Here’s David explaining the app.
DivvyBrags
DivvyBrags is a extension for the web browser Google Chrome that helps riders brag about the milage they’ve racked up using the Divvy system and was built by Alex Soble. As an extension, the app isn’t accessing the Divvy servers so the only way to get to the users information is for the user to log in.
The app keeps track of your bike share mileage and trips and will let you tweet out ‘brags’ about how much you’ve used Divvy.
Here’s Lynn Garnaat demoing the app. (Alex is in Chile as part of #StartupChile)
DivvyBike Suggestion Heat Map
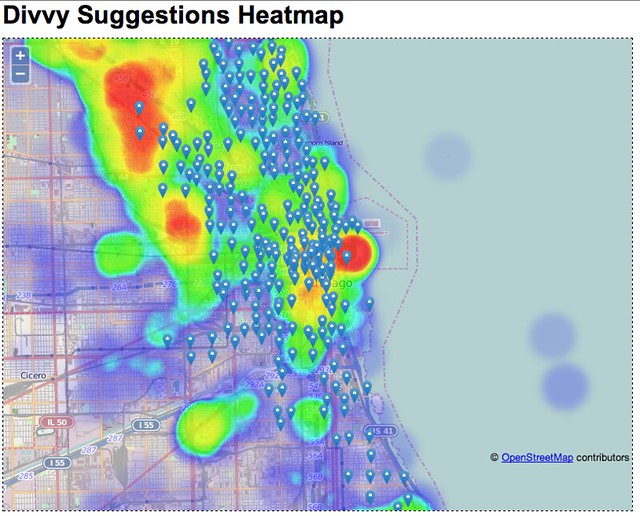
Using the data from the Divvy Shareabouts Suggestions app, Eric Potash created a heat map showing where the most suggestions are coming from. In the video below, Steve Vance explains how it works.
Divvy.BikeChi.org
Steve Vance created a similar app that scrapes the suggestion data and makes it available for download. Using the app you can search for location and see where everyone is suggesting new stations.
Transit Sensor
Software apps weren’t the only thing that was demonstrated. Josh Billions built a sensor was demonstrated that shows if a station has available bikes using the Objective C codebase. The sensor can also be configured to show nearby busses or trains.
Q & A
Elliot and Gabriel also stuck around to answer questions about the data challenge and the Divvy bike share system.
For more information on the Divvy Data Challenge, you can visit their website a http://divvybikes.com/datachallenge. For more information about bike sharing data in general, visit the bikesharing data hack pad at https://bikesharingdata.hackpad.com/.


