Design Thinking Raises Patients’ Profile to Rehab Health Care Access

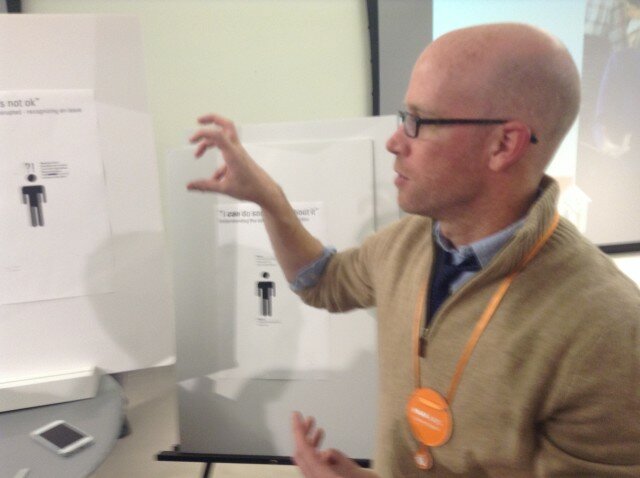
At BarnRaise 2015, Mark King collaborates with the Thresholds mental-health agency on outreach to teens.

At BarnRaise 2015, Mark King collaborates with the Thresholds agency on outreach to teens.

When Chicago technologists diagnose health issues, they turn their attention to how patients and practitioners make decisions.

“It’s always important to understand the domain,” says ThoughtWorks user experience designer Bridget Sheerin. “The classic example is, you try not to build something for which there isn’t a problem.” A less obvious trap, she says, is building great technology that can’t or won’t get used in the field.

The Illinois Institute of Technology’s design institute focused health and tech teams on patient interactions in two days of brainstorming Oct. 13 and 14 at its BarnRaise 2015 “maker-conference.” Teams presented their solutions to a health technology crowd at Matter, the Merchandise Mart health-care incubator.

“I was amazed at how effective the conference was at bringing people up to speed about something they knew nothing about,” said Ronald Grais, director of the Thresholds mental health agency. Consultant Mark King of Toad & Tadpole suggested ways Thresholds could encourage peer interventions for troubled teens. Grais plans to test them immediately in schools and community programs.

The 13 teams addressed process and strategy issues as well. Smart Chicago Collaborative anchored one team, working with the Design Concepts agency to build patients’ health and computer literacy.

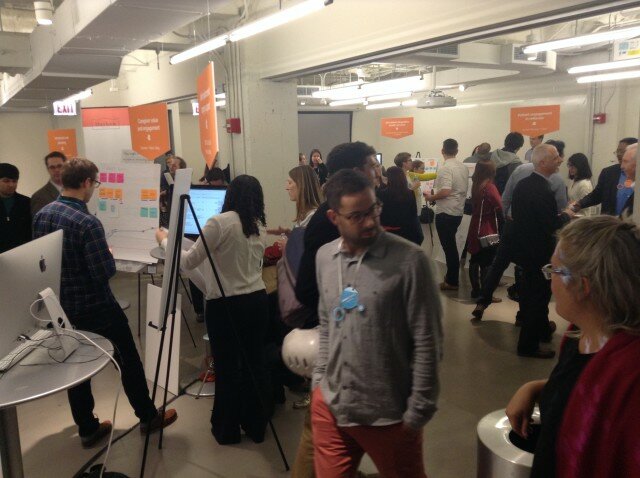
BarnRaise 2015 partners present their work at the Matter health-care incubator.

BarnRaise 2015 partners present their work at the Matter health-care incubator.

IIT matched software developer ThoughtWorks with Janus Choice and its Virtual Liaison app, which refers hospital patients to long-term care providers. Janus chief technology officer Daryl Palmer says ThoughtWorks brought experience in coaching technologies that complemented Janus’ development talent.

“We wanted to make sure we were looking at the social and cultural mindsets of users at final discharge,” Palmer says. “Patients can’t go home, they have to go to a skilled nursing facility, and we have to explain where they are in the process.”

Janus wanted a better handoff for accident victims, for whom the diagnosis is still sinking in. “We tried through a design process to understand what that experience is like for a patient and a nurse,” says Sheerin. “It’s not about building a prettier interface but understanding the entire journey they go through.”

The team interviewed nurses on how they used the iPad app to locate intensive rehab or continuous care resources. “The nurses are under extreme time pressure to get patients out of the hospital. They need patients to comfortable with the choices they’re making. The device makes the narrowing-down process a lot faster for the patients, which cuts cuts down on the time pressure on the nurses.”

More often it’s nurses or family members using the tablet app to find follow-up care, not the patients themselves. The result has to please all parties, including the hospitals paying for the app. They expect a payoff in better use of their own beds and lower readmission rates.

ThoughtWorks suggested video and other tools to connect nurse recommendations with doctors’ orders, and updates on patients’ rehab progress to keep nurses engaged.

The YMCA of the USA approached rehab from a different angle. It worked with Rêve Consulting to structure pilot programs bringing joint replacement patients into local gyms and swimming pools to shape up before surgery, as well as to recuperate afterward.

Chicago health providers facing widespread issues used BarnRaise partners to plan a local response. The American Medical Women’s Association and the Mad*Pow agency worked to spread stroke awareness.

The BarnRaise collaborators decided they must spread the word about about stroke symptoms to a younger audience, who could act quickly if a family member is stricken.

“Trust is an issue,” says Heather Beckstrom, stroke program coordinator for Mount Sinai Hospital Medical Center. Immigrants fear deportation, while minorities expect a struggle to get the immediate care that can save stroke victims’ lives. “How do you get into a community where there is distrust?”

The solution was to build on relationships with community activists and organizations like the Chicago Housing Authority. “It gives us a different strategy and outlets to tap into,” Beckstrom says.

Healthy Chicago 2.0: Health Action Plan Marshals Community, Data to Target Root Causes

Chicago’s public health goals are shifting toward battling crime, tenement housing and other stubborn social concerns. Nearly a year of data-driven community discussions have led the city’s health professionals to look beyond their traditional roles treating infections, substance abuse and other conditions.

“There are chunks of population in Chicago that are just suffering tremendously, and we just aren’t targeting our resources in the right way,” says Jaime Dircksen, deputy commissioner of the Chicago Department of Public Health. “We started this process with equity in mind, and with the goal of achieving equity across the city. I think having that lens really led to people feeling comfortable talking about some of the causes of these problems.”

Attacking these problems meant coming up with an approach other city departments would support in their own programs. Now the Healthy Chicago 2.0 plan is being circulated in City Hall for unveiling in late fall. Its priorities emerged in a community-driven process, developed for public health agencies with the federal Centers for Disease Control and Prevention.

“This plan is not the health department’s plan, it’s the city’s plan. Everyone plays a role in improving the health of the city,” Dircksen says. “We will be meeting with city department heads to make sure they understand what’s being put forth in the plan and will champion the plan. Then we’ll convene the interagency council of city agencies and share with them the draft of everything,. We’re identifying the opportunities where we can create synergy. “

Data to the people

Some 800 people contributed to the goal-setting process, a quarter of them in 10 working groups that set objectives and strategies. A data-intensive approach kept this potentially unwieldy goal-setting effort on track.
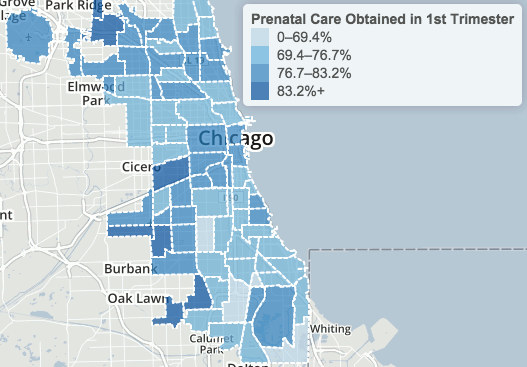
Percent of live births in which mother began prenatal care during 1st trimester, 1999 - 2009 (Chicago Health Atlas)

Percent of live births in which mother began prenatal care during 1st trimester, 1999 – 2009 (Chicago Health Atlas)

Public-health staffers gave work-group volunteers a thick stack of statistics on births and deaths, hospitalizations and personal habits. They mapped health outcomes by neighborhood, conducted survey research and adopted novel ways to probe the underlying causes of chronic diseases.

Finally, they faced down the realities of an austere 2016 city budget. The health department controls only $149 million directly, a 4 percent cut. Most of that is set aside for AIDS, women’s and children’s health, mental-health and emergency services.

“There’s a strong paradox constantly at work,” says Nikhil Prachand, the health department’s director of epidemiology and public health informatics. “It’s impossible to narrow down the priorities, but if you don’t have a lot of money it should be easy to narrow down the priorities. “

Smart Chicago will play a role in measuring the plan’s success. The city will use the Chicago Health Atlas website to mark progress toward goals for 2020.

“We will have a dashboard of indicators monitoring every action area,” Dircksen says. A website update will “really dive deep into community area data so that the community can see progress,” she says. “Community-based organizations can use it as a resource for funding opportunities and monitoring their own work.”

Planning began last year with surveys in English and Spanish, asking broadly about a healthy environment. Residents across the economic spectrum united around safety and access to healthy food as citywide needs. Yet there wasn’t much agreement on neighborhood needs.

In areas under economic stress, crime emerged as the top priority. In affluent areas – nearly half the sample – respondents were more concerned about the built environment as a local issue. The widest gulf was in access to education, based on agreement with statements like, ”Schools in my neighborhood have what they need to provide a high quality education.”

Tackling broader issues like safety, Dircksen argues, takes “understanding that people aren’t going to parks because they don’t feel safe, they’re not well lit, there’s trash all over the place, that’s where the gang violence happens — then thinking out how to respond to those issues.”
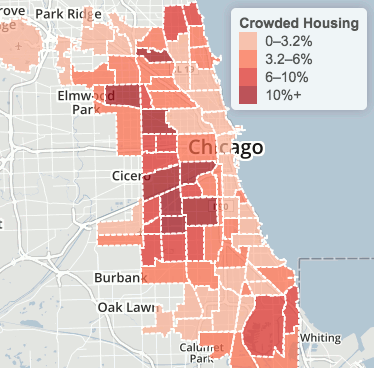
Percent of occupied crowded housing units, 2007-2011 (Chicago Health Atlas)

Percent of occupied crowded housing units, 2007-2011 (Chicago Health Atlas)

Root causes

Five panels probed more deeply into the equity questions. “They did a focus group with our hotline volunteers to hear the stories they’ve heard,” says John Bartlett, executive director of the Metropolitan Tenants Organization. “And they asked about their lives also, because many of them are tenants.“

University of Illinois at Chicago students scored the responses, along with content from a half-dozen StoryCorps oral histories. They found common themes – problems navigating mainstream society and a sense of powerlessness. Again, health issues were linked to larger social problems.

“For example, mold will trigger asthma,” Bartlett says. “We are continually counseling parents whose children have uncontrolled asthma, informing them of steps they have to take to get their landlords to make the environment safer for their kids. Oftentimes landlords can be recalcitrant about that.

“We will inspect units for things like paint dust, and if there is, work with the health department to get a city inspection and encourage families to get their kids tested,” he adds. “And bedbugs are definitely a stressor in people’s lives. They blame themselves, but it’s not anyone’s fault. These creatures are just hitchhiking all over the place.”

The next step was to share the results with local health advocates. Many were frustrated at the lack of money, equity, attention and political will to take on core issues. And they saw traps ahead for clients navigating Affordable Care Act enrollment and mental health clinic closures.

“We were happy because the city was making efforts to be accessible and to be inclusive of the disabilities community,” says Gary Arnold, spokesman for Access Living, which hosted one of the advocate forums.
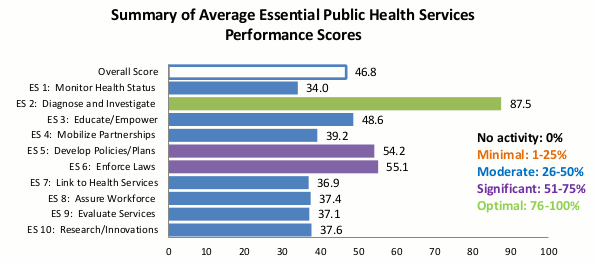
Local Pubic Health System Assessment (Chicago Department of Public Health)

Local Pubic Health System Assessment (Chicago Department of Public Health)

Opportunities and threats

In one exercise, service providers scored the local health system using a CDC-approved framework. Working groups saw electronic health records posing opportunities for data sharing and monitoring, and threats from uneven adoption and stale information.

Health advocates saw new communication tools as potential threats, raising access barriers or triggering changes in brain development and socialization. But technology also was part of the solution: Ideas included wrist monitors, health provider networks and a 2-1-1 phone line to take health and human service calls.

“We ended up with 50 priorities, and they’re all very important,” Dirksen says. Grouping them yielded a more workable list of 16 themes, which were ranked by public and private stakeholders in the Partnership for Healthy Chicago. The city convened 10 expert panels this summer to draft objectives and strategies in key areas.

HEALTHY CHICAGO 2.0 ACTION AREAS

  1. Access to healthcare and human services
  2. Behavioral Health
  3. Chronic disease prevention and control
  4. Community development
  5. Data & Research
  6. Education equity
  7. Infectious Disease
  8. Maternal, Infant, Child and Adolescent Health
  9. Partnerships and Community Engagement
  10. Violence and Injury Prevention

“The first thing is laying out the roadmap then creating the will to fund it,” says Bartlett, who joined the community development team. “If we’re serious about having a healthier Chicago we need to look at prevention. All the departments dealing with housing should be on the same page looking at health as part of the decision-making process. How do we make sure Chicago housing is affordable and healthy? It’s not good to have only one without the other. “

Distributed network

The teams will reconvene next month to draft detailed plans. Eight final themes will mirror the action areas, with data and engagement as strategies throughout. “We can’t do any of this work without having the data to inform it, the research to gather additional data – and it’s an all-hands-on-deck effort,” Dircksen says.

Data will help make the case for funds, and track whether they’ve been spent wisely. “Community development is focused primarily on capital improvements – improving CTA stations, rehabbing schools, building structures,” Prachand says. “We have been able to assess the health of the city’s commercial areas and offered a number of metrics. We can monitor over time and give feedback whether these capital improvement projects and grand plans are having some impact on people. “

The plan calls for more community input, in projects such as locating new Divvy bike stations on the South Side. “How do you know where the next best place is? Not necessarily by looking at a map,” Dircksen says. “They have to talk to the community leaders and stakeholders. We’re talking about the public health planning and transportation planning worlds coming together, and working together to identify mutual benefit and priorities.”

The city will count on private agencies to take on some of the burden. “Funders are wholly committed to obesity, metal health, access to care, violence prevention,” Dircksen says. “They appreciate and understand housing is health care. But then they’re giving across the city, not making a great impact, and not necessarily using evidence-based strategies. How do we work with them to make sure they understand what the evidence is and what does work, and concentrate their efforts in places or with populations which we know need the most?”

“It’s our job to mobilize and motivate the community to be a part of this,” she adds. “By 2020 we expect to achieve all the things we’ve laid out. I think with this process we will have a lot of engagement come launch because people will have been involved throughout the process. There’s a lot of evidence that when you engage people from the very beginning, they’re more likely to buy in, they’re more likely to act.

“If we don’t address environment and community conditions and access to care, we’ll never be able to impact the lives of people,” she adds. “At the forefront we will focus on those root causes of why folks are overweight, why they’re smoking, why they aren’t caring for their chronic conditions or their mental illness, or why pregnant moms can’t get prenatal care or can’t deliver a healthy baby.”
Health Advocates Weigh Data, Equity in Obesity Targets

Health workers review the Consortium to Lower Obesity in Chicago Children policy agenda on Sept. 16, 2015.

Health workers review Consortium to Lower Obesity in Chicago Children policy agenda.

Childhood obesity is a stubborn problem to reverse in communities starved for cash. In a new five-year plan, Chicago health advocates put a priority on targeting funds and tracking results.

“We are not seeing significant improvement in disparities,” dietitian and food consultant Tracy A. Fox told the Consortium to Lower Obesity in Chicago Children. The group outlined its policy agenda at a Sept. 16 meeting.

A decades-long rise in obesity rates has leveled off at 17 percent, according to Centers for Disease Control and Prevention data. “It’s a plateau at an insanely high rate,” Fox said.

The overall trend also disguises rising obesity rates among minorities. “For African-Americans in particular we are seeing pretty significant increases. So I think we have our work cut out for us,” she said.

“As you discuss your policy agenda for this coalition, I would think about always viewing what you’re doing through the lens of how this would impact disparities,” Fox advised. “If you’re going into a middle- or upper- income school and you’re making significant changes, that’s really cool and that’s really nice. But are you then widening the gap between what’s happening in the city with African American and Latino kids and white middle- and upper-income kids?”

The group is refocusing priorities as both city and state lawmakers consider one of its initiatives, a tax on sugary beverages.

“There’s an argument to be made, if you’re just looking to lower consumption, then where that money goes is maybe not as important as just raising the price of soda,” said executive director Adam Becker. Still, the group is pushing for proceeds to benefit public health instead of sweetening general revenues.

“The feasibility is not really a question anymore,” Becker said. “It’s more the political will.”

The City Council health committee in September considered a penny-an-ounce tax. But its chair, Ald. George Cardenas (12th Ward) has not committed to advancing the plan. A state tax on distributors gained Chicago and suburban sponsors but has not advanced in the Legislature.

“It shows momentum,” said Elissa Bassler, chief executive of the Illinois Public Health Institute. “It’s being seriously considered as a source of revenue to improve health and invest those revenues into health initiatives.”

As new policies gain traction, data analysis has emerged as a priority. “Just because a bill got signed into an act or an ordinance passed doesn’t necessarily mean the things you intended to have happen are indeed happening,” Becker said. “A lot of the real hard work comes when you have to then monitor where things are going.”

Obesity and overweight in kindergarten, 6th and 9th grades, 2012-13 (Chicago Public Schools)

Obesity and overweight pupils in kindergarten, 6th and 9th grades, 2012-13 (Chicago Public Schools)

For example, Illinois requires schools to take body-mass measurements, but the consortium wants the data tracked to identify areas in need. In the latest review of Chicago Public Schools data, roughly half of students were overweight or obese in 11 of Chicago’s 77 community areas.

The coalition of public-health advocates wants to build on recent legislative victories. Childcare centers in Illinois now must meet standards on physical activity, nutrition, screen time and breastfeeding. The group seeks to extend the licensing requirements to child-care family homes.

Less sugar and fat are now required in subsidized school food programs, along with more vegetables, fruits, whole grains, lean protein and low-fat dairy. The consortium wants to maintain the higher standards and expand a federal summer nutrition program, which reaches only 15 percent of eligible children in Illinois.

“We work a lot in school breakfast,” said Bob Dolgan, executive director of the Greater Chicago Food Depository. “And it’s surprising even in low-income school districts how few administrators think about the fact that they have children coming to school without a meal and not eating until lunchtime. How can they possibly concentrate and excel in school without a meal?”

The group also pledges to spread novel ideas such as doubled food stamp benefits at farmers’ markets, a loan pool to build grocery stores in food deserts, and a “baby friendly” designation for hospitals that support breastfeeding.

And it advocates plans to encourage recreation and make streets safer. “In the first several iterations of the transportation bill, there’s been a big shift of more money for walking and bicycling,” said Melody Geracy, deputy executive director of the Active Transportation Alliance. “It is still a microscopic grain of sand in terms of the overall transportation budget. Still, it’s a target” for cost-cutters, Geracy said.

The group’s five-year plan retools an agenda set at a 2010 conference of local advocates. Policy-focused members shared a draft this spring with the group’s executive committee. Becker said national advisors provided details on policy specifics. Lurie Children’s Hospital, where the consortium is based, checked for conflicts with its own positions.

“You all as a city are probably farther ahead than a lot of even big urban cities in terms of really trying to come together with a unified agenda,” Fox told the group.

The policy document says political support is “particularly threatened” for federal health supports such as Racial and Ethnic Approaches to Community Health. The CDC program pays for health screening in Chicago minority communities.

She advised local advocates to talk up their victories. “The more evidence base you have, the better,” she noted, but success stories from the front lines are more likely to engage lawmakers.

Local policy strategists suggested that closing gaps in outcomes will require wider access to preventive care. “Reducing disparities isn’t the same as creating equity,” said Joseph Harrington, regional health officer for the Illinois Department of Public Health.

Issue Primer: Health

Health Datapalooza CodeathonFor this year’s National Day of Civic Hacking, we’re writing up primers on different civic issues to help people get a better understanding of the issues as they start working on projects.

Below, we’ve listed out places where you can data on health, some examples of projects centered around health and human services , and some resources online to help you with your project.

Health and Human Services 

Healthcare and the social services that are often connected to it is an extremely complicated and expensive issue. According to the Kaiser Foundation, the United States spent about $2 trillion dollars on health care.

In addition to regular healthcare, state and local governments spend a tremendous amount of funds on social services. The effects of the recession, pension crises in multiple states, and cuts from Congress have caused state and local governments to make drastic cuts to social services. This happened at exactly the time that more people required social services putting significant strain on the social safety net.

Aside from the big picture, the experience of those receiving social service is an innately human one – and an experience that most Americans don’t have. Most Americans at some point have to go to the DMV and the experience is often portrayed as downright in pop culture as downright terrible. The experience of being on social services often is worse – not in just the big picture sense, but in small ways. The social safety net is managed by a multitude of government agencies and nonprofit organizations.

Technology projects, such as mRelief, center around health and human services often try and help residents better navigate and understand the resources available to them.

Data Resources 

Data.gov/health

The federal data portal contains over 800 datasets on health. We’ve highlighted some key ones:

  • Hospital Charge Data: Data are being released that show significant variation across the country and within communities in what providers charge for common services. These data include information comparing the charges for the 100 most common inpatient services and 30 common outpatient services.  Providers determine what they will charge for items and services provided to patients and these charges are the amount the provider’s bills for an item or service.
  • Community Health Status Indicators (CHSI): to combat obesity, heart disease, and cancer are major components of the Community Health Data Initiative.
  • CDC Cancer Statistics: The United States Cancer Statistics (USCS) online databases in WONDER provide cancer incidence and mortality data for the United States for the years since 1999, by year, state and metropolitan areas (MSA), age group, race, ethnicity, gender, childhood cancer classifications and cancer site.

County Government Data 

Many county governments administer their own health and human service systems – some of which release this data to the public.

Cook County, IL (https://datacatalog.cookcountyil.gov) 

  • Burial Locations: The following page lists the final disposition sites of the indigents buried by the Cook County Medical Examiner’s Office.
  • Health & Hospitals System – Outpatient Registrations, by Facility, Zip Code, Month – Fiscal Year 2011: Enclosed data represents outpatient registrations including hospital ancillary services

San Francisco, CA [City and County] (data.sf.gov)

  • Child Care Subsidies, San Francisco, CA: Data illustrate the total number of state and non-state child care subsidies available as well as the number of children (0-12 years old) that are eligible for subsidies and the difference between these two numbers by zip code in San Francisco.
  • HSA 90 Day Emergency Housing Waitlist: Provides the seniority list for entry into HSA 90 day emergency shelter waitlist. The list will be generated on 2/24/14 and updated twice daily.

State Government Data 

States administer Medicare, Medicaid and often provide funding for local health and human service programs. Below is a highlight of some state data sets.

Illinois (data.illinois.gov) 

  • Affordable Care Act (ACA) Enrollment Summary Data: Affordable Care Act (ACA) enrollment data by age, race, gender, and county. (PDF)
  • Reportable Communicable Disease Cases, 2010 – 2012: Data provided by the Communicable Disease Section of the Office of Health Protection’s Division of Infectious Diseases

New York (data.ny.gov) 

  • Assisted Outpatient Treatment) Court Orders: This dataset contains the number recipients with AOT petitions and court orders and their length of time on court order, by county, region and statewide.
  • Genealogical Research Death Index Beginning 1957: The Genealogical Research Death Index assists individuals with locating New York State (NYS) death records that fall within defined genealogy years, exclusive of New York City recorded death records

City Government Data

Cities are also releasing data on health and social services. Here’s some highlights from different cities.

Chicago (data.cityofchicago.org) 

  • Food Inspections: This information is derived from inspections of restaurants and other food establishments in Chicago from January 1, 2010 to the present.
  • Neighborhood Health Clinics (Historical): Former neighborhood health clinic locations, hours of operation and contact information. These clinics were closed or transferred to private management in July 2012
  • Infant Death Mortality in Chicago: This dataset contains the annual number of infant deaths annually, cumulative number of infant deaths, and average annual infant mortality rate with corresponding 95% confidence intervals, by Chicago community area, for the years 2005 – 2009

Boston (https://data.cityofboston.gov)

  • Asbestos Removal Permits: Boston Public Health Commission Asbestos permitting removal of asbestos.

New York City (https://nycopendata.socrata.com) 

  • New York City Leading Causes of Death: The leading causes of death by sex and ethnicity in New York City in since 2007
  • New York City Health and Hospitals Corporation (HHC) Patient Satisfaction Survey: Patient satisfaction at HHC hospitals is measured by a standardized survey known as the Hospital Consumer Assessment of Healthcare Providers & Systems (HCAHPS). The survey has been validated by the federal Centers for Medicare and Medicaid Services (CMS) as a standard assessment tool for all hospitals throughout the nation.
  • Most Popular Baby Names by Sex and Mother’s Ethnic Group, New York City: The most popular baby names by sex and mother’s ethnicity in New York City.

Potential Partners

The best civic apps are built through partnerships between technologists, residents, and the people who work on the front lines. Here’s a list of potential partners you can work with in your own cities to help build projects that can make an impact.

Health Data Consortium: The Health Data Consortium is a public-private partnership working to foster the availability and innovative use of open health data to improve health and healthcare. This organization is particularly useful for government agencies looking for help opening up health data.

Code for America Health Focus Team: The health focus area works to improve the health of people and their communities. Code for America works with the wide variety of teams that contribute to these outcomes—including city health departments, public health agencies, state offices, and non-profit organizations.

Smart Chicago CollaborativeSmart Chicago’s multiple health initiatives provide equipment, training, and information that allow residents to take action to improve their own health. We are strong advocates for promoting open data practices in the healthcare field. Smart Chicago is always happy to talk and share our work.

Local Health Departments: Local health departments are in the trenches on a daily basis working to make their communities healthier and can make great partners.  The Chicago Department of Public Health was one of the first city agencies to jump into civic hacking with the Chicago Flu Shot app.

Examples of Health Related Projects

mRelief 

mRelief is a site that simplifies the social service qualifying process with an easy-to-use form that can be accessed online and through SMS. Residents can check to see if they’re eligible for a variety of programs including food stamps, medicaid, WIC, and more.

EBT Near Me 

EBTNearMe is the easiest way to find stores and surcharge-free ATMs where you can use your EBT card in California. It was build by the Code for America Health Team because California welfare recipients pay nearly $20 million per year in ATM surcharge fees partially because there isn’t an easy way to find the free ones.

It’s an open source project built with public retailer data from the USDA and ATM data graciously shared by the CA Office of Systems Integration.

Foodborne Chicago

Foodborne Chicago uses computers & code to search Twitter for tweets related to food poisoning in Chicago. The system does as much as it can to automatically zero-in on the tweets Foodborne thinks are really about a possible food poisoning case and really coming from Chicago. Then real humans from the Chicago Department of Public Health review the tweets and @reply back to people with a link back to this page where Foodborne asks for additional information. When they fill out the online form, it becomes a 311 service request to inspect the suspect restaurant.

Chicago Health Atlas

The Chicago Health Atlas a place where you can view citywide information about health trends and take action near you to improve your own health. The site displays large amounts of data from sources like the City of Chicago, State of Illinois, and local hospitals so you can get big-picture views of health statistics in Chicago like hospital admissions, uninsurance rates, cause of death, birth rates. and drill down deep into neighborhoods to see specific information and how it compares to the city overall.

People to follow on Twitter

@lippytalk: Jake Solomon is a member of Code for America’s health focus team and spent time on SNAP benefits so he could better understand the challenges that users face.

@reedmonseur: Raed Mansour works on #publichealth tech innovations for @ChiPublicHealth like @FoodBorneChi, BU #HealthComm Faculty, APHA Member, @PurdueAlumni & @BUalumni.

@PublicHealth: Official account of the American Public Health Association: For science. For action. For health.

@CDCgov: CDC’s official Twitter source for daily credible health & safety updates for Centers for Disease Control & Prevention.


The City of Chicago unveils predictive analytics model to find foodborne illness faster

city-of-chicago-tech-planCity of Chicago Chief Data Officer Tom Schenk Jr spoke at last week’s Chi Hack Night to talk about their new system to predict the riskiest restaurants in order to prioritize food inspections – and has found a way to find critical violations seven days faster.
Below, we’ve put up the slides from their presentation as well as the highlight video:

The problem with the way that most cities conduct food inspections is that by law they have to inspect all of them. However, the number of restaurants far outweigh the number of inspectors. In Chicago, there’s one inspector for every 470 restaurants. Since they have to inspect them all, the normal way of doing this is random inspections. However, the team knew that the residents wouldn’t get foodborne illness at random restaurants – they would get sick from those few restaurants who don’t follow all the rules.

The Department of Innovation and Technology partnered with the Chicago Department of Public Health and staff from Allstate Insurance to see if they could use analytics predict which restaurants would have critical violations. (Side note: It’s a brilliant move on the part of the City and the Allstate to contribute volunteer hours using something that actuaries specialize in.)  Some of the data sets used to make these determinations were:

    • Establishments that had previous critical or serious violations
    • Three-day average high temperature (Not on the portal)
    • Risk level of establishment as determined by CDPH
    • Location of establishment
    • Nearby garbage and sanitation complaints
    • The type of facility being inspected
    • Nearby burglaries
    • Whether the establishment has a tobacco license or has an incidental alcohol consumption license
    • Length of time since last inspection
    • The length of time the establishment has been operating

 All of the data, with the exception of the weather and the names of the individual health inspector, come directly from the city’s data portal. (Which builds on the city’s extensive work in opening up all this data in the first place.) When factoring all of these items together, the research team was able to provide a likelihood of critical violations for each establishment, which was developed to prioritize which ones should be inspected first.

In order to test the system, they conducted a double-blind study over a sixty day period to ensure the model was correct.

The system has gotten rave reviews and coverage from a number of publications and entities including Harvard University, Governing Magazine, and WBEZ’s Afternoon Shift.

Aside from the important aspect of less people getting sick from foodborne illness in the City of Chicago, there is another very important aspect of this work that has national impact. The entire project is open source and reproducible from end to end. We’re not just talking about the code being thrown on GitHub. (Although, it is on the city’s GitHub account.) The methodology used to make the calculations is also open source, well documented, and provides a training data set so that other data scientists can try to replicate the results. No other city has released their analytic models before this release. The Department of Innovation and Technology is openly inviting other data scientists to fork their model and attempt to improve upon it.

The City of Chicago accepts pull requests as long as you agree to their contributor license agreement.

Having the project be open source and reproducible from end to end also means that this projects is deployable to other cities that also have their data at the ready. (Which, for cities that aren’t, the City’s also made their OpenETL toolkit available as well.)

The Department of Innovation and Technology has a history of opening up their work and each piece they’ve released (from their data dictionary to scripts that download Socrata datasets into R data frames) builds on the other.

In time, we may not only see Chicago using data science to improve their cities – but other cities building off the Chicago model to do so as well.

You can find out more about the project by checking out the project page here.

Foodborne Chicago is a Top 25 Innovation in Government

Foodborne Chicago Twitter characterToday our product, Foodborne Chicago, was recognized by the Ash Center for Democratic Governance and Innovation. Here’s their writeup:

FoodBorne Chicago
City of Chicago, IL

On March 23, 2013, the Chicago Department of Public Health and the SmartChicago Collaborative launched the FoodBorne Chicago web application with the goal of improving food safety in Chicago. FoodBorne Chicago tracks tweets using a supervised machine-learning algorithm that identifies the keywords of “food poison” within the Chicago area. This tool allows residents to report a food poisoning incident through 311 after the program identifies tweets with possible cases of food poisoning. The team then tweets back a link to submit an online web form where residents can identify where they ate, the date and time they frequented the restaurant, their symptoms, and send it through Open311. The information is sent directly to the Department of Public Health and, if warranted, an inspection team visits the restaurant in question and then lets the resident know the status of the investigation via e-mail. The algorithm gets smarter at identifying related tweets as the team replies to residents that are suspected to have a potential case of food poisoning to report. If several complaints occur together, these clusters can be investigated to prevent further illnesses from developing.


And here’s a snip from a press release from Mayor Rahm Emanuel:

The Chicago Department of Public Health (CDPH) has been recognized as a Top 25 program in this year’s Innovations in American Government Awards competition by the Ash Center for Democratic Governance and Innovation at the John F. Kennedy School of Government, Harvard University for its FoodBorne Chicago program.

Two years ago, CDPH and the SmartChicago Collaborative launched the FoodBorne Chicago web application with the goal of improving food safety in Chicago.

“The Department of Public Health and the Department of Innovation and Technology used social media and technology to create a tool that makes food consumption in Chicago safer,” said Mayor Rahm Emanuel. “It is innovative thinking like this that enhances and leverages available resources to make the most impact.”