Themes from #NNIP Dallas 2015

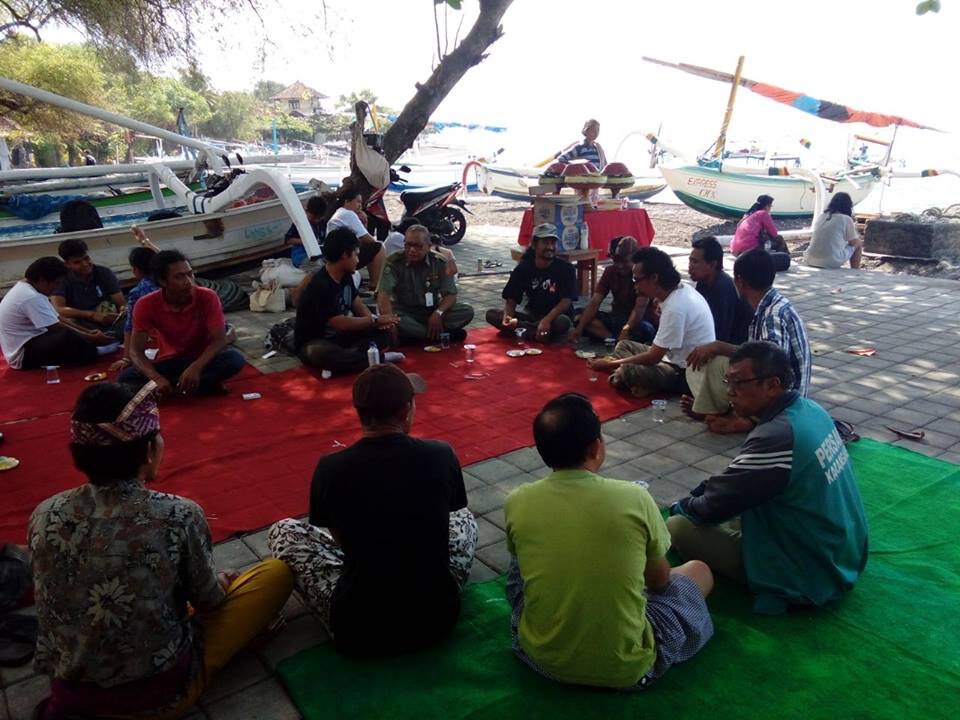
The National Neighborhood Indicators Partnership (NNIP) is a network of trusted city organizations committed to collecting, analyzing, and sharing neighborhood data in service to their communities. Partner organizations convene twice a year to share their work and collaborate on topics from policing to tracking investments in neighborhoods. Last week, I attended the NNIP meeting in Dallas, Texas.

NNIP_PartnersBadge_Logo_RGB

It’s worth noting that the humans behind the number crunching and data visualizations were of extremely high quality. I was struck by the camaraderie, creativity, city pride, and good ole fashioned work ethic coursing through the NNIP culture.

It’s also worth noting that any conference or meeting that starts with a “what’s your favorite dataset?” icebreaker is just awesome.

Here’s a look at the major themes that arose throughout the three days of conversations, panels, and tours.

Neighborhood Data Needs Context

It was no accident that presenters from Dallas, Austin, and other cities had trouble making sense of neighborhood indicators without also nodding to historical and social context.

The first panel of the NNIP meeting was just as much about the origins of geographic inequity as it was about the data of geographic inequity. Nakia Douglas of the Barack Obama Male Leadership Academy, John Fullinwider of Lumin Education, Regina Montoya of the Mayor’s Poverty Task Force in Dallas, Theresa O’Donnell of the City of Dallas, and Donald Payton of the African American Genealogy Interest Group discussed the city’s “divides” – especially the prominent north-south divide.  The panel pointed out that these modern inequalities stem from both historical and present racial discrimination.

nnip 2

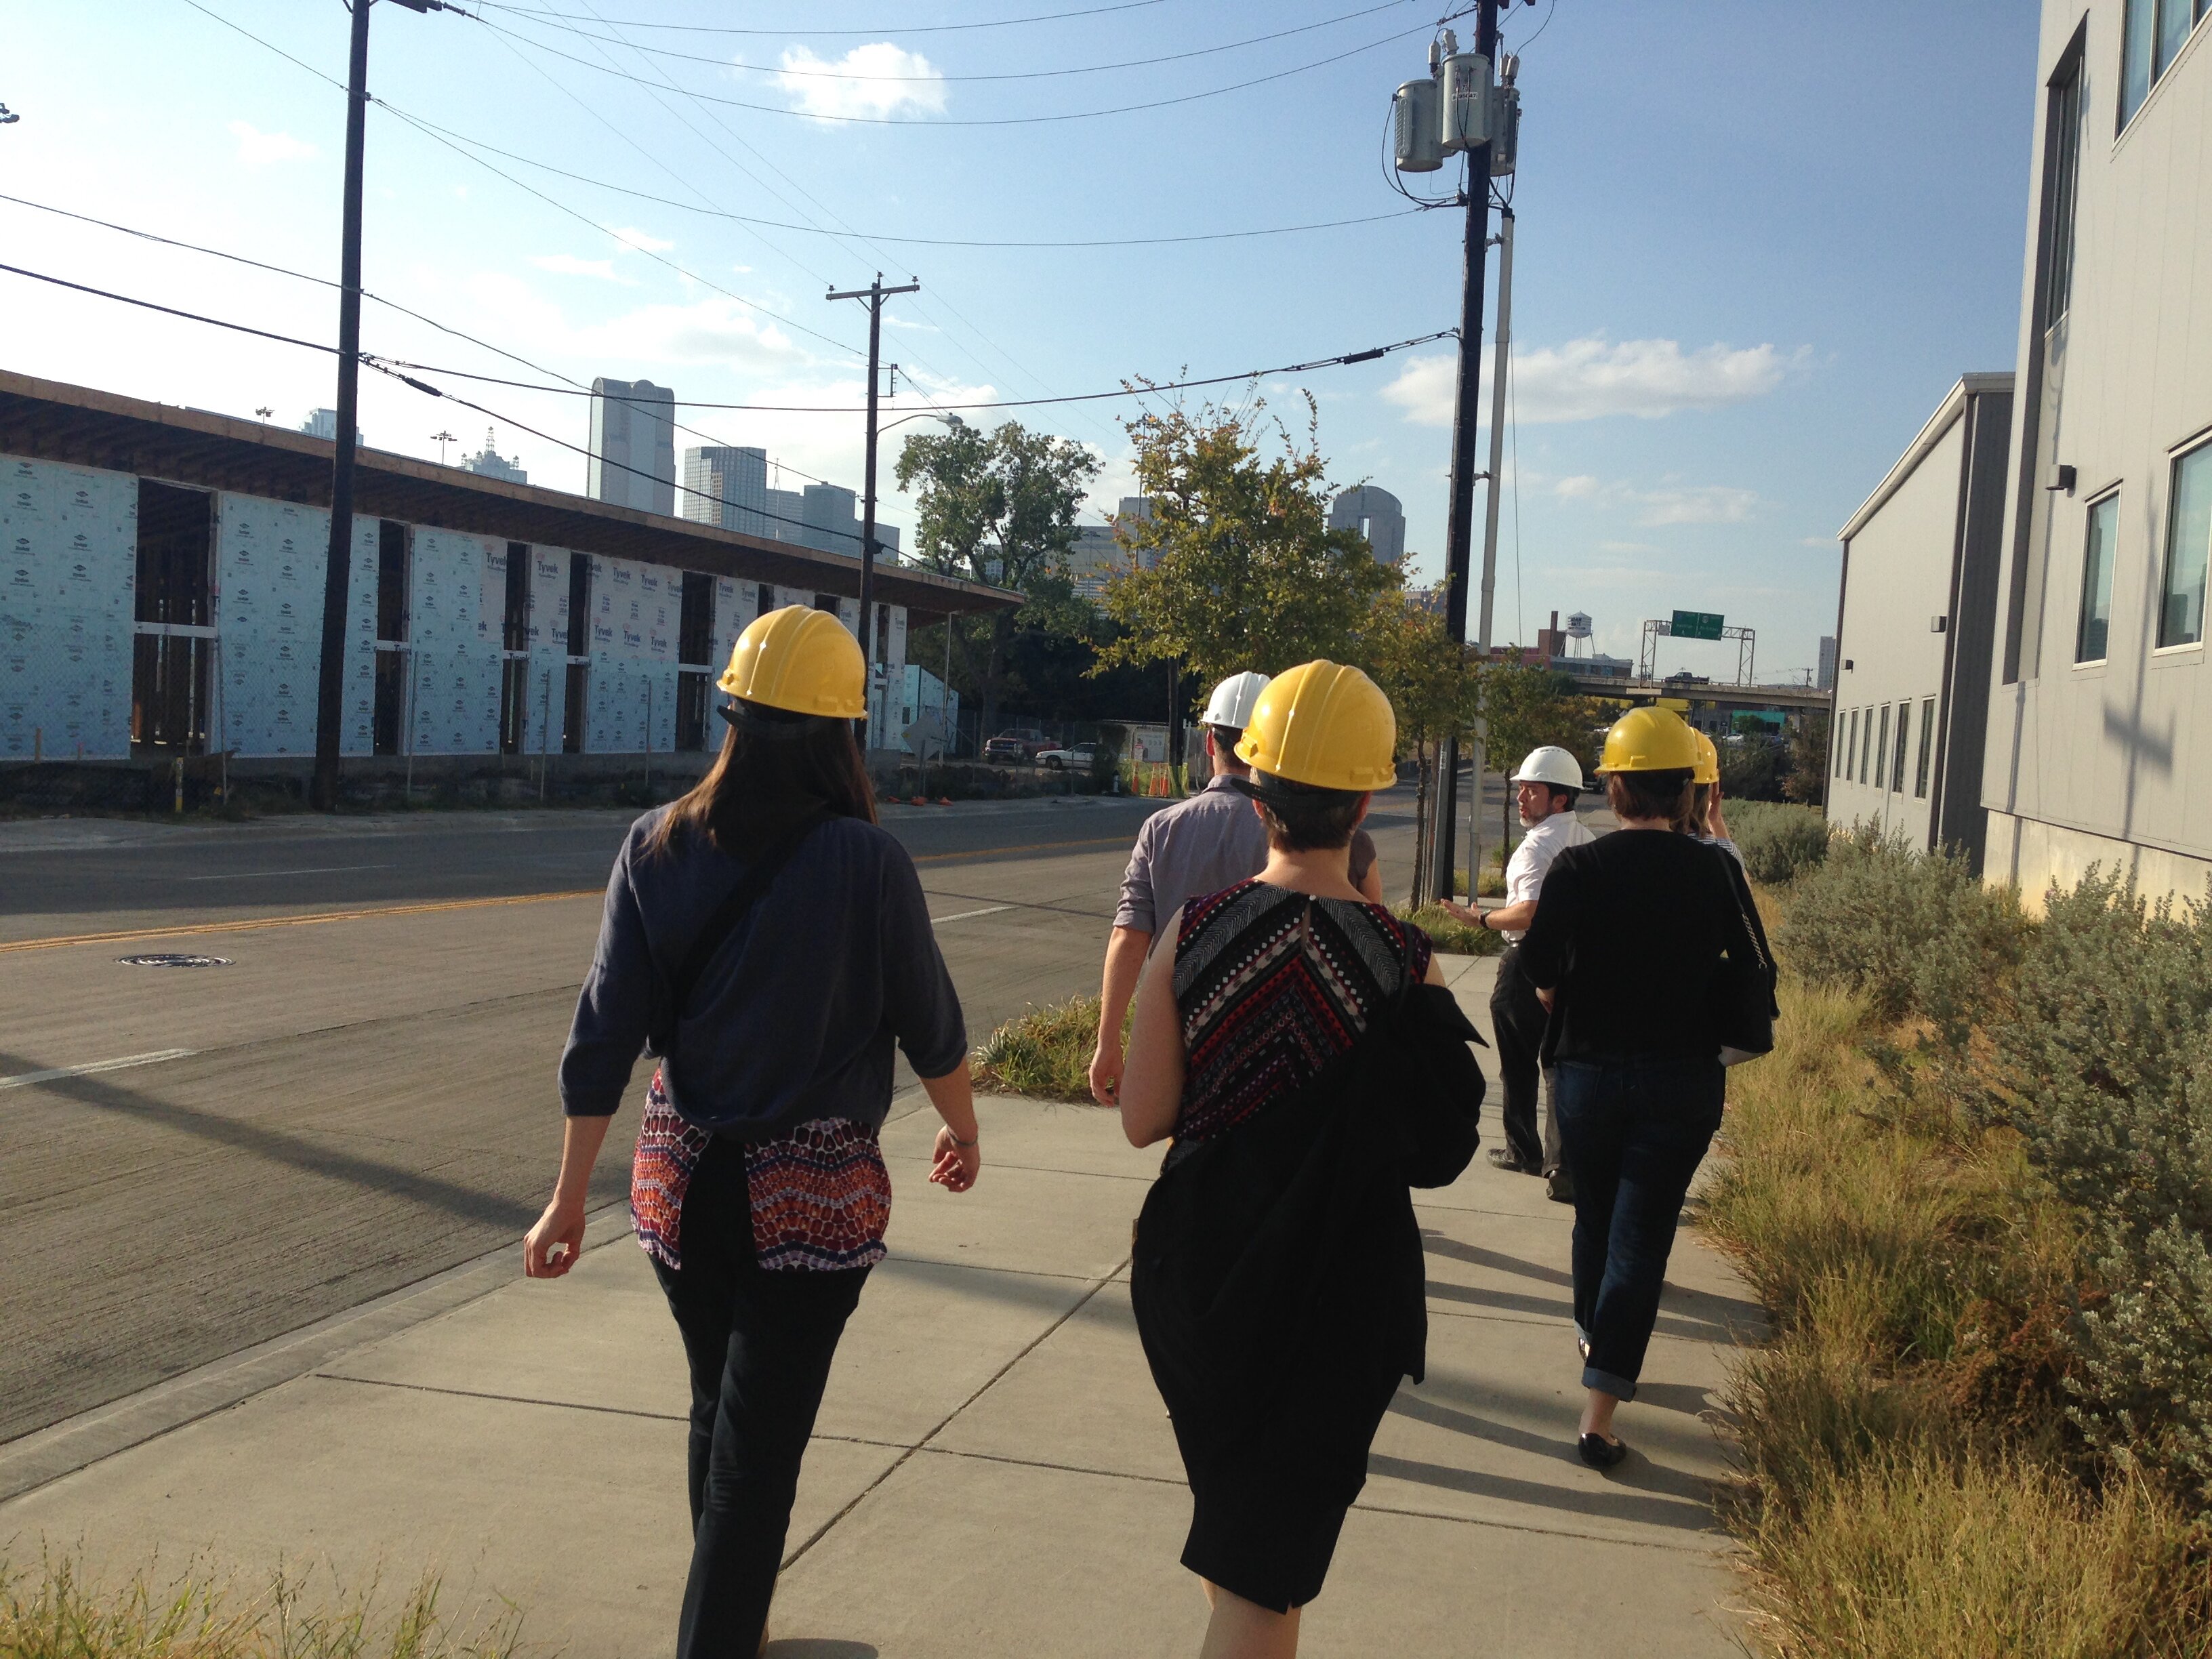
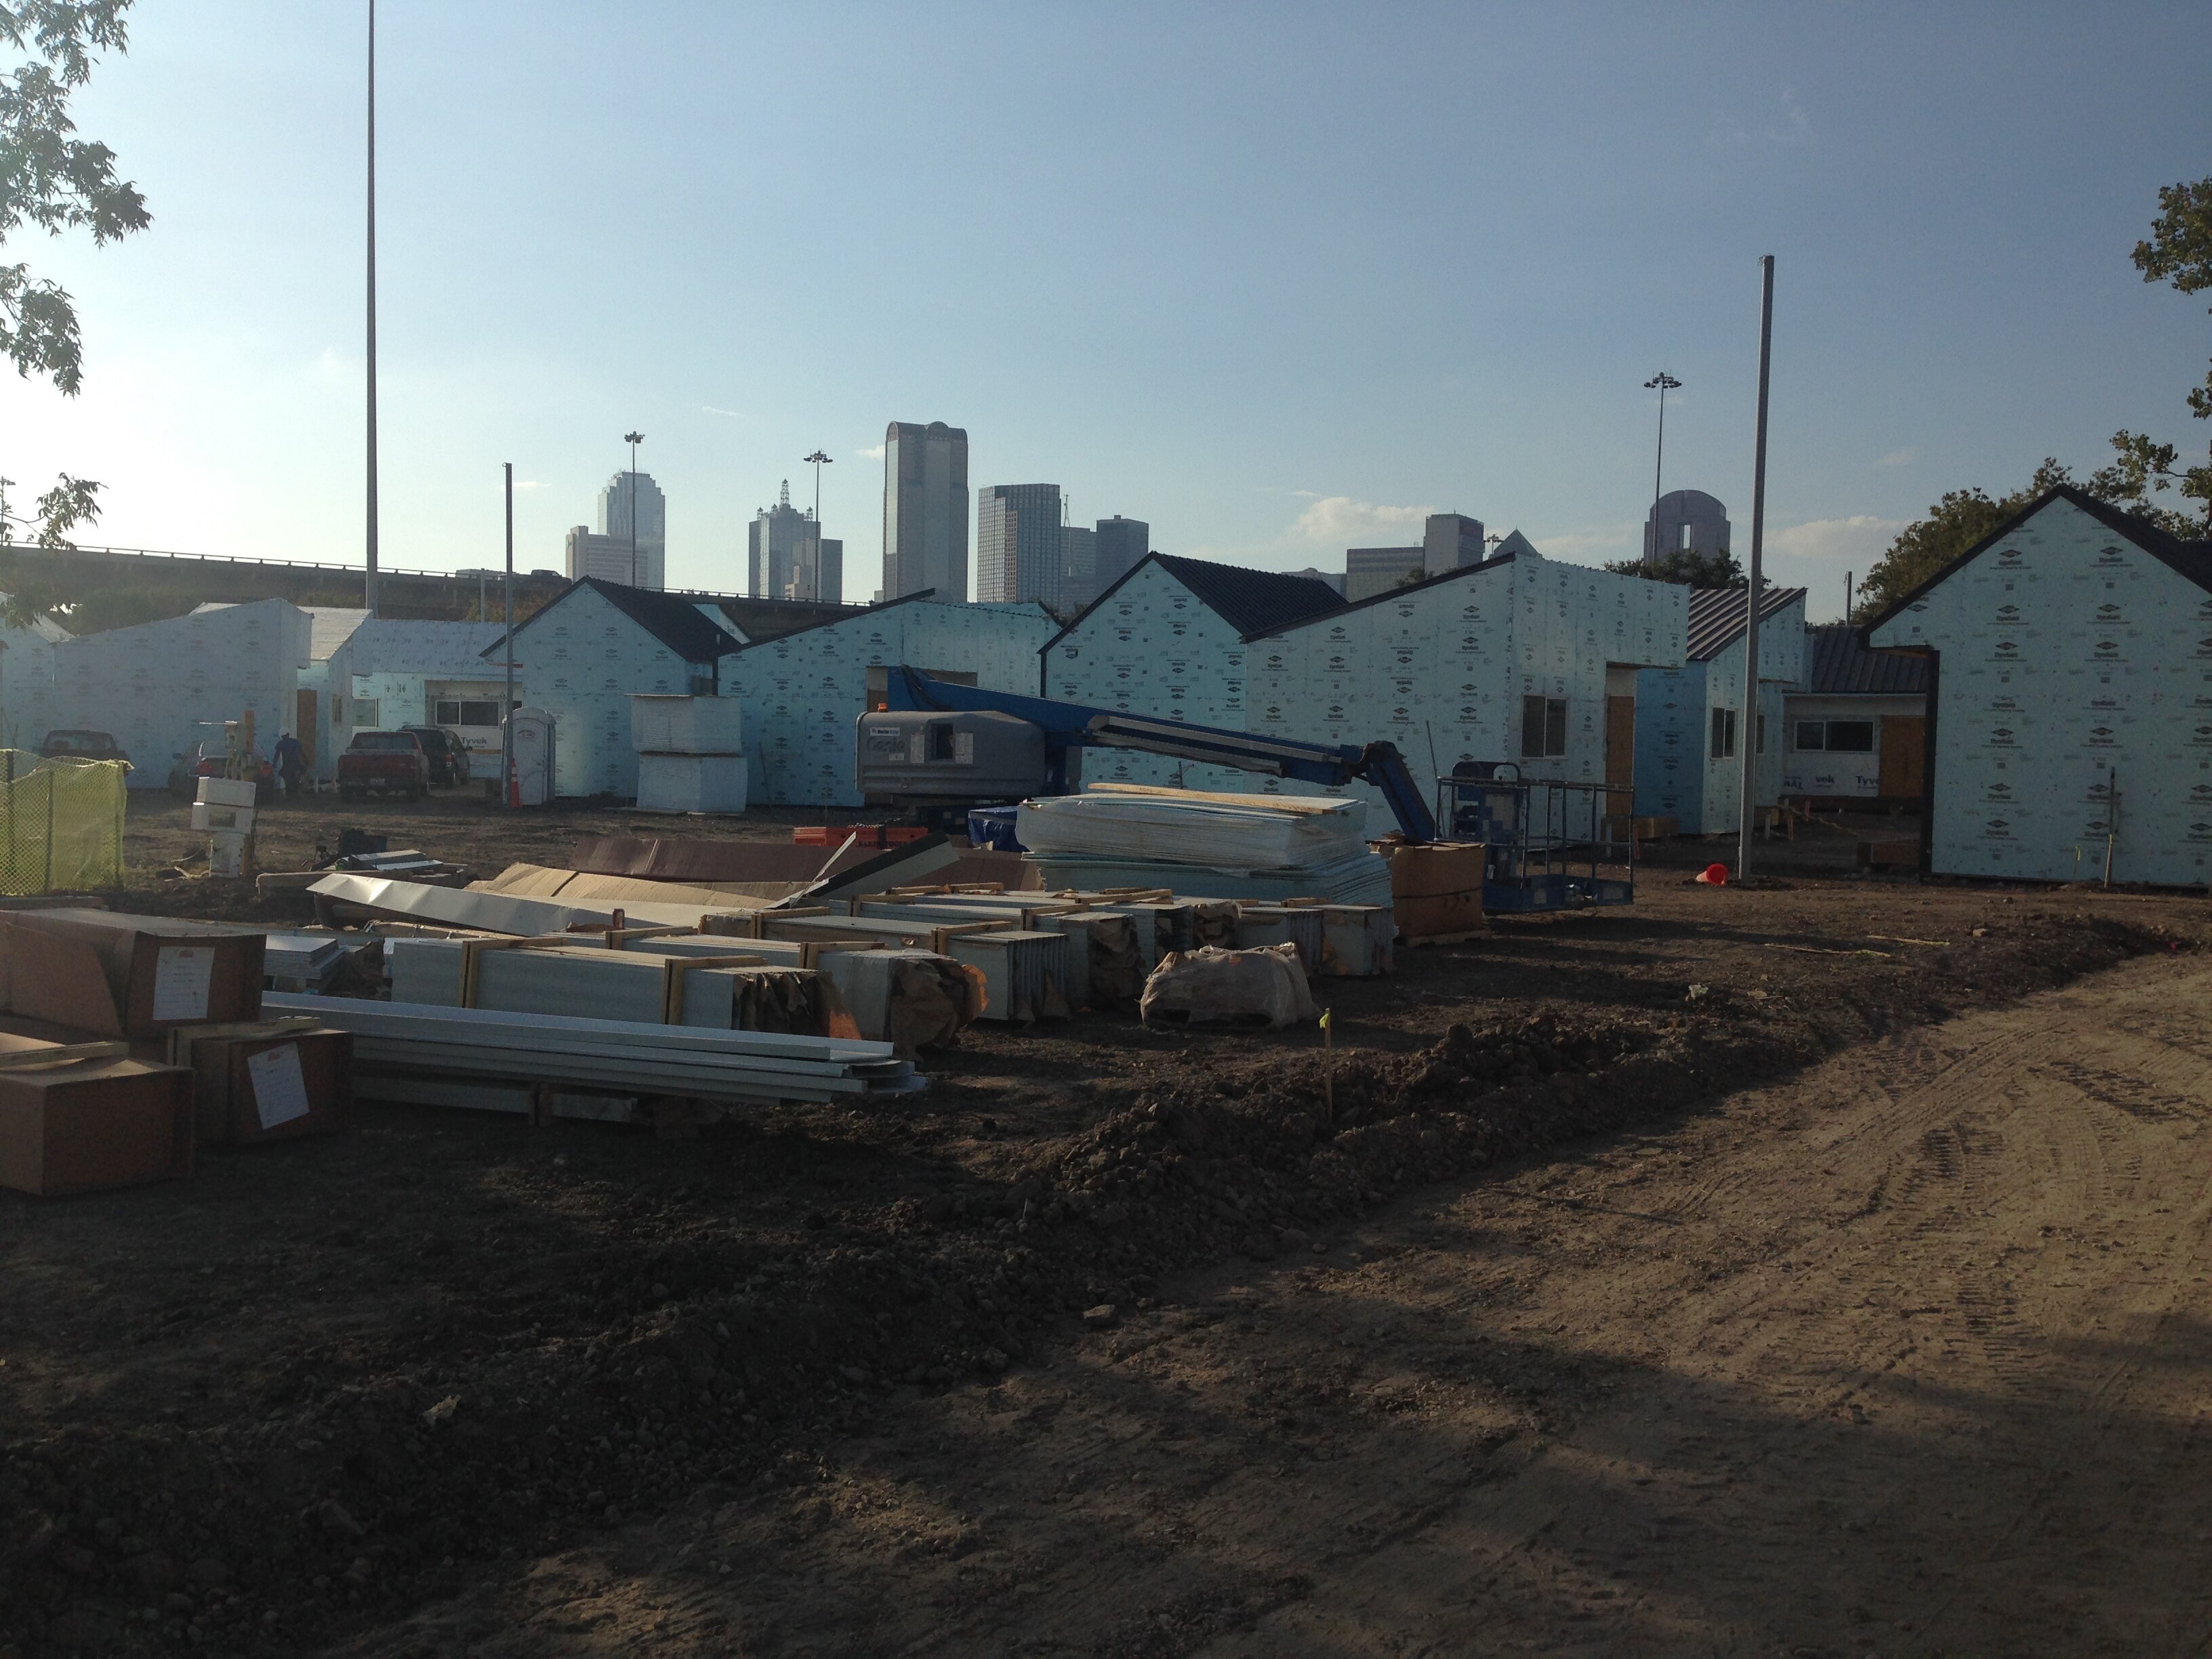
Living out this need for context, NNIP scheduled tours in Dallas. I had the opportunity to visit the Cottages at Hickory Crossing, the city’s first Housing First community. The 50 approximately 400 square foot single occupancy homes are for the homeless, mentally ill, and previously incarcerated. Future residents of the Cottages will have access to a suite of supportive on-site health and social services.

We walked through the construction, asked questions, and learned about the evaluation plans paired with the program. Even before the residents have moved in, the Cottages are planning an evaluation of the initiative – tracking resident outcomes and savings to Dallas taxpayers, for example. Residents are those who incur the highest cost to taxpayers by remaining homeless, less healthy, and less supported.

nnip 1

By the way, the Cottages at Hickory Crossing have their own Target registry if you would like to help furnish the homes!

NNIP Partners as Local Leaders & Conveners

Several NNIP partners discussed how they lead the conversations and collaborations around data within their cities. Many hold “Data Days” – events usually involving trainings and/or collaborations around neighborhood datasets of interest. Milwaukee’s Impact Inc. is holding their first Data Days this week. Charlotte, NC held their Data Days earlier in October.

One of the most interesting examples of data leadership? Every month Cleveland’s NNIP partner, the Center on Urban Poverty and Community Development at Case Western University, convenes all of the city’s organizations that collect data so they can share their work and build up a citywide data catalogue.

To accomplish their local work, NNIP partners form strong, trusted relationships with government agencies, police departments and other public collectors of data. During the meeting, partners what it took to open up in-demand local data and information for residents. One of my favorite insights came from Data-Driven Detroit (D3) who shared concrete advice for cities working with police departments to open up data.

Going forward, I hope NNIP partners can continue to discuss how data can build and repair community relationships in our cities. In Chicago there is so much work to do in this area. Data can be open and free, but if residents don’t trust it, there is still work to be done. Our own Kyla Williams spoke to this on social media while following the NNIP meeting remotely:

Data for Local Action

NNIP isn’t just about the data for data’s sake; it’s about turning data into informed local action. At the end of the day, if the data aren’t useful, used, or noticed then they are worthless. It’s all about democratizing information for community empowerment and smart policy decisions. This theme echoed several times throughout the NNIP meeting. One example was in Impact, Inc.’s mantra: “No data without stories, no stories without data.”

During the meeting, NNIP dared its partners to make their tech ecosystem. What does that mean? It means taking inventory of information lifecycles in your city and where residents and local organizations fall in those process maps. After all, it’s not enough to know how data is collected, analyzed, and repurposed; cities also need to know how neighborhood indicators and data stories can be turned into smart policy changes and smart local programs.

Here at Smart Chicago we’re also been thinking about ecosystem definition, turning data into action, and formulating meaningful resident engagement around Chicago’s data work. Between Array of Things, WindyGrid, and last year’s Chicago School of Data, there’s a lot to talk about! There are also essential Chicago partners with excellent neighborhood data: DePaul’s Institute for Housing Studies, the Woodstock Institute, and the Heartland Alliance. We need to work together to centralize our neighborhood data, engage with residents and make sure that Chicago isn’t just a “smart city,” but a smart city that works for everyone.

NNIP as a Community of Learning

The NNIP meetings are called “meetings” and not conferences for a reason. There was a palpable roll-up-your-sleeves attitude across the participating partners. I heard stories of people traveling to friends and collaborators in other cities to help replicate successful work nationally. Again, this is a great group of humans.

Those of us visiting NNIP or attending for the first time certainly saw the value of these meetings. Collecting, using, and disseminating neighborhood data to improve your city can be slow work with long-term gains. Having a supportive national network facilitating peer learning seems like an essential ingredient to progress.

Well said, April! Let the homework begin!

To see all NNIP documentation on the Dallas 2015 meeting, see their website.

Models for Leveraging Tech to Improve Public Service & Governance in Indonesia

Smart Chicago Collaborative guest blogger Jensi Sartin is a YSEALI State Department Fellow from Indonesia. He is working with the Smart Chicago Collaborative for a month to gain experience in Chicago’s public, philanthropic, and nonprofit sectors — especially on digital issues.

Rising incomes in populous Southeast Asian countries plus plunging smartphone prices have created an Internet boom. It is estimated that there will be 190 million smartphone users in Southeast Asia by end of 2015.  By the end of 2019, that number will be over 340 million! In my country of Indonesia we have the most mobile Facebook users in the world and the capital capital city, Jakarta, has more active Twitter users than any other city in the world.

This digital advancement affects the public, including citizens’ relationship with and communication with government. In Indonesia, you can tweet directly to the governor and, even if it’s an angry tweet, you’re sure to get reply or a retweet. The public also uses online petitions like Change.org to  spread awareness or even force government to shift positions on policies. We’ve even found that using  apps and crowdsourcing can help crackdown corruption in the government.

Organizing rally urging government to eradicate corruption and promote more meaningful transparency in the mining sector.

Organizing rally urging government to eradicate corruption and promote more meaningful transparency in the mining sector.

Despite the fact that Indonesia’s Internet quality is poorer compared to its Southeast Asian neighbor nations, most government agencies have at least two digital channels: a website and a social media account. Some agencies have even created digital platforms for e-Procurement, e-Budgeting, e-Tax, and many more “e-somethings”. For instance, the city of Jakarta, famous for its bad traffic jams, is using social media to make the city more livable.

Environmental damage by a mining company found by combining images from drone mapping with a government map on existing mining concession (the white color area is a lake that has been used to wash bauxite from soil)

Environmental damage by a mining company found by combining images from drone mapping with a government map on existing mining concession (the white color area is a lake that has been used to wash bauxite from soil)

Civic advocacy is also adopting technology in its work. Following the progress of Open Government Partnership and Indonesia’s Freedom of Information Law, a number of projects were launched to promote open data. Civic apps and websites were created to solve problems that are either rarely or inefficiently addressed by government. For instance, KawalPilkada is an app that educates the public  on provincial and city-level elections. Also, a local anti-corruption organization launched opentender.net to crosscheck the procurement process in the government projects.

Community brainstorming with fishermen, the marine tourism operators, and government to develop a joint-program to manage fisheries and marine tourism in the area. This region in east of Bali is one of main tourism destinations that is threatened by the increasing impact of climate change.

Community brainstorming with fishermen, the marine tourism operators, and government to develop a joint-program to manage fisheries and marine tourism in the area. This region in east of Bali is one of main tourism destinations that is threatened by the increasing impact of climate change.

Have all these “e-somethings” improved public service delivery in Indonesia or have they simply  spread the “you are not cool if you don’t have Twitter” feeling? Unfortunately, this question is rarely addressed. The most important thing in this work should be user (or expected user) opinion and experience. It’s about the people that use the technology!  A people-focused  organization, set of methods, and best practices should be established to ensure that new digital tools truly improve public life.

I think this might look like a Smart Chicago Collaborative model in Indonesia with missions in Internet access (like Connect Chicago), in digital skills and education (like Smart Health Centers), and in user-focused tools (like the CUTGroup).  This is why I’m here in Chicago — to learn more about the Smart Chicago model and see how I can apply it to districts in my country!

To learn more about me and follow my work, follow me on Twitter.

Jensi pic 1

Jensi Sartin is a YSEALI Professional Fellow for Legislative and Governance Process of  Department of State and he is hosted by American Council of Young Political Leaders.  YSEALI is President Barack Obama’s signature program to strengthen leadership development and networking in Southeast Asia. Based in Indonesia, Jensi serves as a program development manager of  Publish What You Pay Indonesia’s efforts to promote transparency and accountability in government especially related to governance of extractive sector (i.e. oil, gas, coal, mineral, forestry industry, etc.).  He also provides Reef Check Indonesia with  research and advisory support. Jensi holds a Master’s degree in Natural Resources Management from the James Cook University Australia and a Bachelor’s Degree in Marine Sciences from Diponegoro University.

Madonna Scholars + Smart Chicago

madonna-foundation-logoToday Smart Chicago and The Chicago Community Trust hosted a number of Madonna Scholars of the Madonna Foundation. The Madonna Foundation was established in 2001 by the Franciscan Sisters of Chicago, and is a public charity that increases access for young urban women to attend Catholic high schools in the Chicago area.

In addition to financial aid, the Foundation is dedicated to support the academic, psychological, spiritual and social needs of young women. These needs are addressed through a series of unique and innovative programs and service learning opportunities that provides young urban women the opportunity to build a meaningful, productive and successful life for themselves and leaders for future generations.

Today we talked about Smart Chicago, our founding partners, the CUTGroup, Connect Chicago, and Youth-Led Tech. Most of all, we’ll be listening to them and hearing how they use technology to make their lives better. 

This is just one of the ways we seek to strengthen ties between their neighborhoods and the robust public technology scene here in Chicago.

Here’s a set of pics from our day together and a group pic, below:

Madonna Scholars at Smart Chicago


New Cook County Data: Fiscal Year 2016 Executive Budget Recommendation

On Wednesday, the Cook County Department of Budget and Management Services released the Executive Recommendations for the Fiscal Year 2016. As with previous years the Budget is available as a series of PDFs.

As part of our work with Cook County Open Data we helped create and post three datasets as part of this year’s Executive Recommendation Budget release:

  1. Budget Summary By Object Classification: This dataset lists by department the Department Request and Executive Recommendation dollar amounts for each line item. (We helped publish this data last year too.)
  2. Budget Summary Of Positions By Business Unit: This dataset lists by department and business unit the proposed position counts and salaries.
  3. Capital Equipment: This dataset contains a list of capital equipment projects along with the requested dollar amount.

With these dataset releases we made several improvements over last year’s Executive Recommended Budget release:

  • Timeliness: This year we wanted to try to release open data on the same day as the PDFs were released. Over the past several weeks we have been working with staff in the Department of Budget and Management Services to make that possible for these datasets.
  • New Types of Datasets: Last year only the Budget Summary By Object Classification dataset was released. We wanted to identify additional data that is part of the budget process. In preparation for this year’s budget season we went through last year’s Budget Book PDFs to identify potential new datasets. From there, we worked with staff in the Department of Budget and Management Services to identify who is responsible for each type of data and to develop the final open dataset.
  • Data Lens: We wanted to go beyond just providing the data tables so we took this as an opportunity to try out Socrata’s Data Lens view that was launched earlier this year. The Data Lens views have interactive graphs and search functionality. They act as an alternative view to the spreadsheet style of the main dataset. We have Data Lens views for all 3 datasets:
    • Budget Summary by Object Classification
    • Budget Summary Of Positions By Business Unit
    • Capital Equipment Projects
  • Open Data in Context: While the Open Data Portal makes it easy to find these budget datasets if you are on the portal, we wanted to ensure that users going to the county’s website to learn about the proposed budget had easy access to the open data and Data Lens visualizations. To accomplish that, for the first time this year, links to the Data Lens views are included with the PDF links on the budget page.

Over the next several weeks there will be Departmental Reviews and Public Hearings on the Executive Recommendation Budget. See the Cook County Budget Calendar for the complete schedule including links to live streams and public hearing speaker registration.

Cook County Executive Recommendation Budget FY2016

Healthy Chicago 2.0: Health Action Plan Marshals Community, Data to Target Root Causes

Chicago’s public health goals are shifting toward battling crime, tenement housing and other stubborn social concerns. Nearly a year of data-driven community discussions have led the city’s health professionals to look beyond their traditional roles treating infections, substance abuse and other conditions.

“There are chunks of population in Chicago that are just suffering tremendously, and we just aren’t targeting our resources in the right way,” says Jaime Dircksen, deputy commissioner of the Chicago Department of Public Health. “We started this process with equity in mind, and with the goal of achieving equity across the city. I think having that lens really led to people feeling comfortable talking about some of the causes of these problems.”

Attacking these problems meant coming up with an approach other city departments would support in their own programs. Now the Healthy Chicago 2.0 plan is being circulated in City Hall for unveiling in late fall. Its priorities emerged in a community-driven process, developed for public health agencies with the federal Centers for Disease Control and Prevention.

“This plan is not the health department’s plan, it’s the city’s plan. Everyone plays a role in improving the health of the city,” Dircksen says. “We will be meeting with city department heads to make sure they understand what’s being put forth in the plan and will champion the plan. Then we’ll convene the interagency council of city agencies and share with them the draft of everything,. We’re identifying the opportunities where we can create synergy. “

Data to the people

Some 800 people contributed to the goal-setting process, a quarter of them in 10 working groups that set objectives and strategies. A data-intensive approach kept this potentially unwieldy goal-setting effort on track.

Percent of live births in which mother began prenatal care during 1st trimester, 1999 - 2009 (Chicago Health Atlas)

Percent of live births in which mother began prenatal care during 1st trimester, 1999 – 2009 (Chicago Health Atlas)

Public-health staffers gave work-group volunteers a thick stack of statistics on births and deaths, hospitalizations and personal habits. They mapped health outcomes by neighborhood, conducted survey research and adopted novel ways to probe the underlying causes of chronic diseases.

Finally, they faced down the realities of an austere 2016 city budget. The health department controls only $149 million directly, a 4 percent cut. Most of that is set aside for AIDS, women’s and children’s health, mental-health and emergency services.

“There’s a strong paradox constantly at work,” says Nikhil Prachand, the health department’s director of epidemiology and public health informatics. “It’s impossible to narrow down the priorities, but if you don’t have a lot of money it should be easy to narrow down the priorities. “

Smart Chicago will play a role in measuring the plan’s success. The city will use the Chicago Health Atlas website to mark progress toward goals for 2020.

“We will have a dashboard of indicators monitoring every action area,” Dircksen says. A website update will “really dive deep into community area data so that the community can see progress,” she says. “Community-based organizations can use it as a resource for funding opportunities and monitoring their own work.”

Planning began last year with surveys in English and Spanish, asking broadly about a healthy environment. Residents across the economic spectrum united around safety and access to healthy food as citywide needs. Yet there wasn’t much agreement on neighborhood needs.

In areas under economic stress, crime emerged as the top priority. In affluent areas – nearly half the sample – respondents were more concerned about the built environment as a local issue. The widest gulf was in access to education, based on agreement with statements like, ”Schools in my neighborhood have what they need to provide a high quality education.”

Tackling broader issues like safety, Dircksen argues, takes “understanding that people aren’t going to parks because they don’t feel safe, they’re not well lit, there’s trash all over the place, that’s where the gang violence happens — then thinking out how to respond to those issues.”

Percent of occupied crowded housing units, 2007-2011 (Chicago Health Atlas)

Percent of occupied crowded housing units, 2007-2011 (Chicago Health Atlas)

Root causes

Five panels probed more deeply into the equity questions. “They did a focus group with our hotline volunteers to hear the stories they’ve heard,” says John Bartlett, executive director of the Metropolitan Tenants Organization. “And they asked about their lives also, because many of them are tenants.“

University of Illinois at Chicago students scored the responses, along with content from a half-dozen StoryCorps oral histories. They found common themes – problems navigating mainstream society and a sense of powerlessness. Again, health issues were linked to larger social problems.

“For example, mold will trigger asthma,” Bartlett says. “We are continually counseling parents whose children have uncontrolled asthma, informing them of steps they have to take to get their landlords to make the environment safer for their kids. Oftentimes landlords can be recalcitrant about that.

“We will inspect units for things like paint dust, and if there is, work with the health department to get a city inspection and encourage families to get their kids tested,” he adds. “And bedbugs are definitely a stressor in people’s lives. They blame themselves, but it’s not anyone’s fault. These creatures are just hitchhiking all over the place.”

The next step was to share the results with local health advocates. Many were frustrated at the lack of money, equity, attention and political will to take on core issues. And they saw traps ahead for clients navigating Affordable Care Act enrollment and mental health clinic closures.

“We were happy because the city was making efforts to be accessible and to be inclusive of the disabilities community,” says Gary Arnold, spokesman for Access Living, which hosted one of the advocate forums.

Local Pubic Health System Assessment (Chicago Department of Public Health)

Local Pubic Health System Assessment (Chicago Department of Public Health)

Opportunities and threats

In one exercise, service providers scored the local health system using a CDC-approved framework. Working groups saw electronic health records posing opportunities for data sharing and monitoring, and threats from uneven adoption and stale information.

Health advocates saw new communication tools as potential threats, raising access barriers or triggering changes in brain development and socialization. But technology also was part of the solution: Ideas included wrist monitors, health provider networks and a 2-1-1 phone line to take health and human service calls.

“We ended up with 50 priorities, and they’re all very important,” Dirksen says. Grouping them yielded a more workable list of 16 themes, which were ranked by public and private stakeholders in the Partnership for Healthy Chicago. The city convened 10 expert panels this summer to draft objectives and strategies in key areas.

HEALTHY CHICAGO 2.0 ACTION AREAS

  1. Access to healthcare and human services
  2. Behavioral Health
  3. Chronic disease prevention and control
  4. Community development
  5. Data & Research
  6. Education equity
  7. Infectious Disease
  8. Maternal, Infant, Child and Adolescent Health
  9. Partnerships and Community Engagement
  10. Violence and Injury Prevention

“The first thing is laying out the roadmap then creating the will to fund it,” says Bartlett, who joined the community development team. “If we’re serious about having a healthier Chicago we need to look at prevention. All the departments dealing with housing should be on the same page looking at health as part of the decision-making process. How do we make sure Chicago housing is affordable and healthy? It’s not good to have only one without the other. “

Distributed network

The teams will reconvene next month to draft detailed plans. Eight final themes will mirror the action areas, with data and engagement as strategies throughout. “We can’t do any of this work without having the data to inform it, the research to gather additional data – and it’s an all-hands-on-deck effort,” Dircksen says.

Data will help make the case for funds, and track whether they’ve been spent wisely. “Community development is focused primarily on capital improvements – improving CTA stations, rehabbing schools, building structures,” Prachand says. “We have been able to assess the health of the city’s commercial areas and offered a number of metrics. We can monitor over time and give feedback whether these capital improvement projects and grand plans are having some impact on people. “

The plan calls for more community input, in projects such as locating new Divvy bike stations on the South Side. “How do you know where the next best place is? Not necessarily by looking at a map,” Dircksen says. “They have to talk to the community leaders and stakeholders. We’re talking about the public health planning and transportation planning worlds coming together, and working together to identify mutual benefit and priorities.”

The city will count on private agencies to take on some of the burden. “Funders are wholly committed to obesity, metal health, access to care, violence prevention,” Dircksen says. “They appreciate and understand housing is health care. But then they’re giving across the city, not making a great impact, and not necessarily using evidence-based strategies. How do we work with them to make sure they understand what the evidence is and what does work, and concentrate their efforts in places or with populations which we know need the most?”

“It’s our job to mobilize and motivate the community to be a part of this,” she adds. “By 2020 we expect to achieve all the things we’ve laid out. I think with this process we will have a lot of engagement come launch because people will have been involved throughout the process. There’s a lot of evidence that when you engage people from the very beginning, they’re more likely to buy in, they’re more likely to act.

“If we don’t address environment and community conditions and access to care, we’ll never be able to impact the lives of people,” she adds. “At the forefront we will focus on those root causes of why folks are overweight, why they’re smoking, why they aren’t caring for their chronic conditions or their mental illness, or why pregnant moms can’t get prenatal care or can’t deliver a healthy baby.”

Honorary Chicago + Documenters Program

Public Way!Tomorrow is the first of three sessions we’re running with Linda Zabors of Honorary Chicago to help improve the data on her website, which collects and displays “the who, where, and why of Chicago’s brown honorary street signs…. and other commemorative honors”.

We’re helping put together a crew of five people from our Documenters program who will review bound books of the Journal of the Proceedings of City Council at the Chicago Public Library. Linda will guide them through the sections to look for and the documenters will take pics and enter info into a spreadsheet so that it can be ported onto the website.

All of this is a part of digitizing the official records of the streets from City Council data not yet available in digital format to help complete Linda’s research of 30 years of honorary sign designations (more than 2,000 signs!).  Most of 1985-present has been collected, there are some gaps, especially in the 2003-2009 timeframe.

We’re going to help her with that. This is a perfect project for our Documenters program, for a number of reasons:

  • Focus is on city data and helping people understand a central record of our municipal government
  • Gets Chicago residents paid while learning and being civically engaged
  • Helps out a great actor in civic tech who has already done an enormous amount of work
  • We get to hang out at one of our central shared spaces— the public library!

We are looking to expand our corps of available documenters, so if you are someone you know is interested in joining us, complete this form. If you have further questions, contact Director of Operations Kyla Williams at .